In technical terms, following the 5-week rally on Gold, a sustained drop below the 23.6% Fibonacci retracement level of the recent rally from February to April indicates a potential further decline in the short term. However, caution is advised for bearish traders as oscillators on the daily chart are still positive, albeit losing momentum. Waiting for confirmation with a break below the $2,300 level is advisable before anticipating deeper losses, possibly to around $2,260-2,255 or even $2,225, before finding support at $2,200-2,190.
XAUUSD – D1 Timeframe
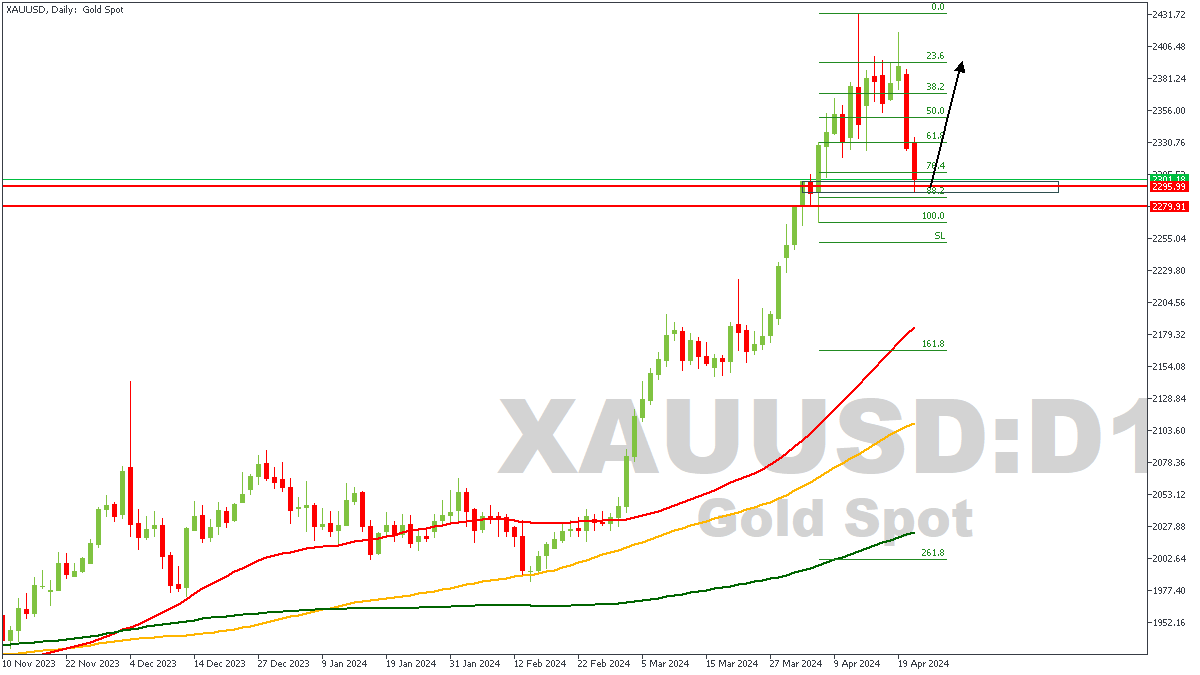
As usual, our analysis of XAUUSD begins from the higher timeframe; which in this case is the Daily timeframe. On the Daily timeframe of XAUUSD, we see price currently trading within the vicinity of a demand zone, the demand zone itself falling within the optimal region of the Fibonacci retracement level.
XAUUSD – H1 Timeframe
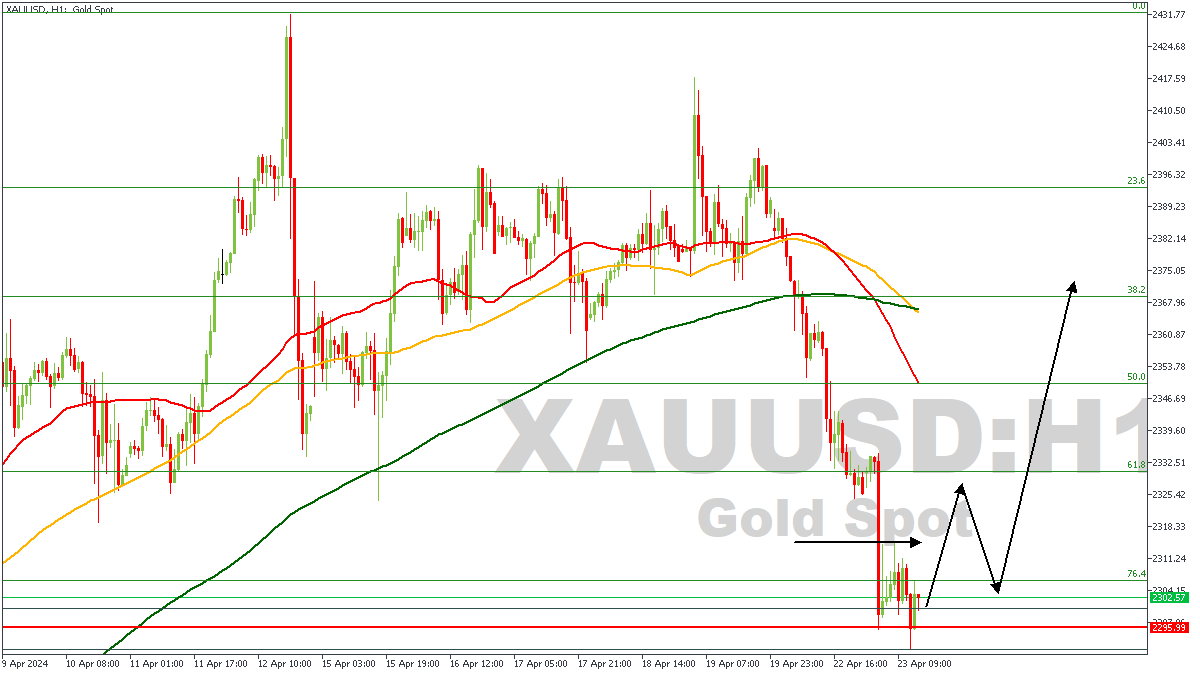
The 1-hour timeframe of XAUUSD presents us a price action that is currently forming in waves, and appears to be setting up for a change-of-character (ChoCh). It is thus my expectation that price would break above the highlighted high before I can settle into a bullish order. In the meantime, however, my fingers are crossed as I patiently await the change-of-character.
Analyst’s Expectations:
Direction: Bullish
Target: $2,392
Invalidation: $2,279
CONCLUSION
The trading of CFDs comes at a risk. Thus, to succeed, you have to manage risks properly. To avoid costly mistakes while you look to trade these opportunities, be sure to do your due diligence and manage your risk appropriately.
You can access more of such trade ideas and prompt market updates on the telegram channel.
