Gold (XAUUSD) prices fell by one percent on Tuesday to the $2,310s amid positive market sentiment, dampening demand for the safe-haven metal. A recent report by the World Gold Council highlighted that strong central bank and over-the-counter buying drove the Gold price rally in Q1. Central banks added 290 tons to their holdings, while OTC buying rose by 136.4 tons compared to the previous quarter. Despite a decline in global Gold ETF holdings, demand from the jewelry and technology sectors remained resilient.
XAUUSD – D1 Timeframe
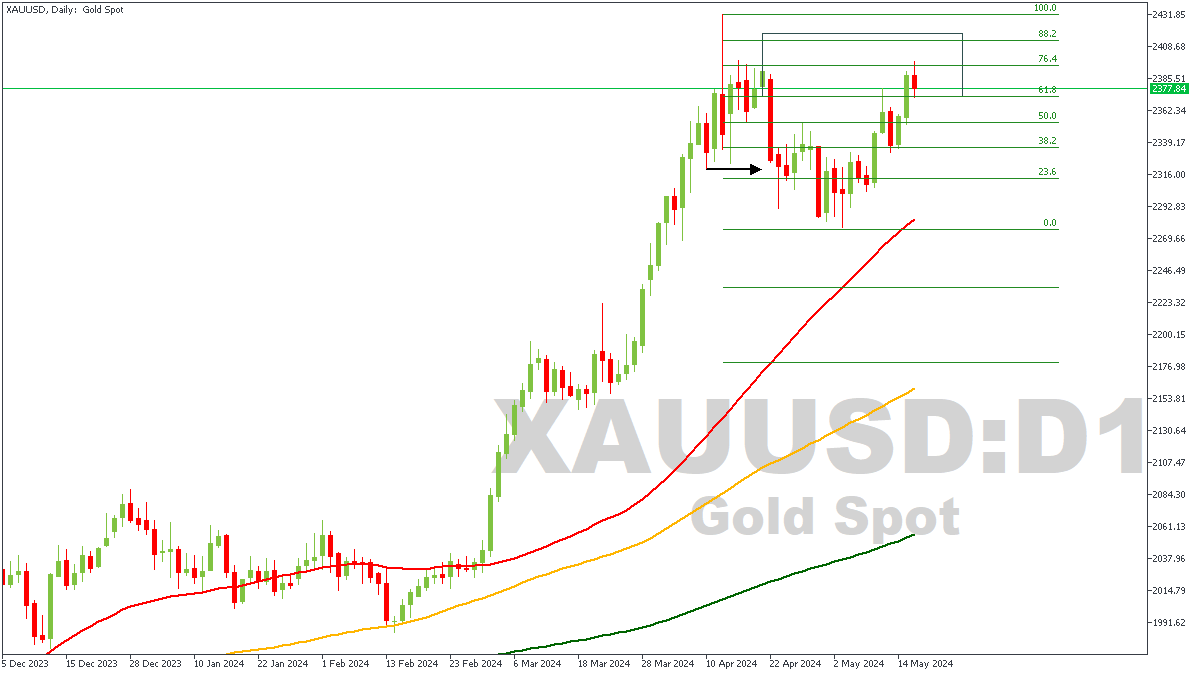
The daily timeframe chart of Gold (XAUUSD) presented above clearly shows the break of structure at the highlighted low. The current price action falls within the 88% region of the impulse that broke structure, meaning the current price action could easily be considered as a retracement. In line with this, let’s take a look at the lower timeframe.
XAUUSD – H4 Timeframe
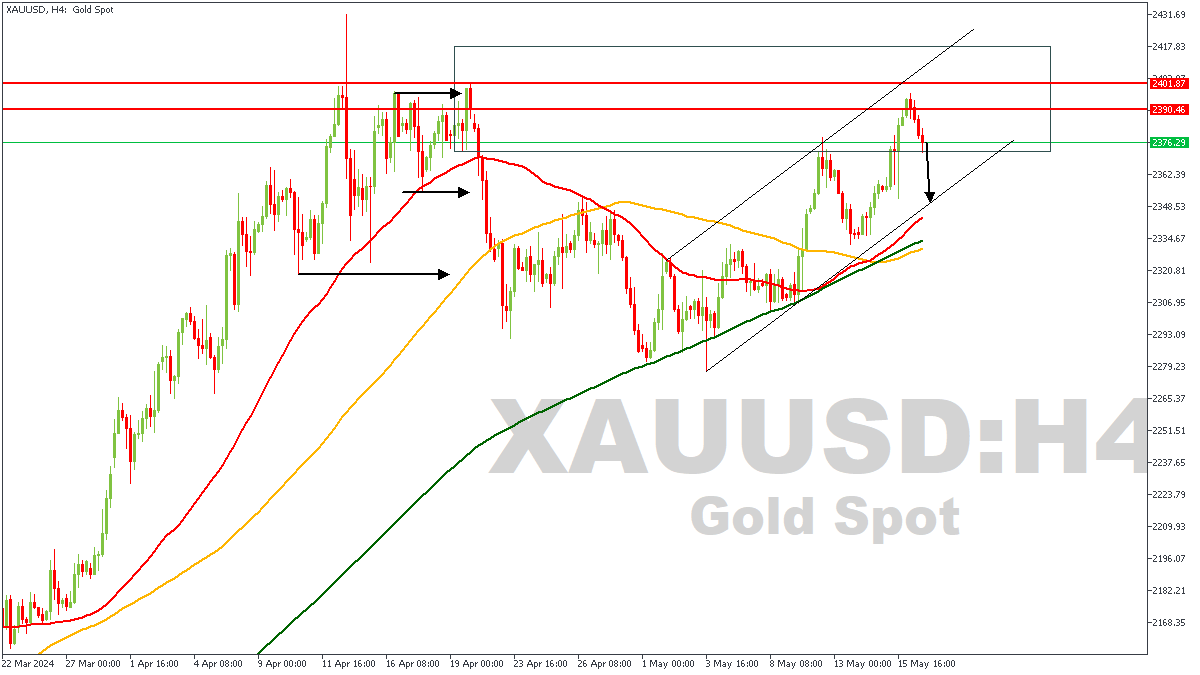
On the 4-hour timeframe of XAUUSD, we can see the rising channel that price seems to currently be trading within. Based on this, my sentiment is largely bearish, considering the fact that price is currently printing a consolidation pattern whilst approaching a key area of supply. The higher timeframe Fibonacci retracement level, supply zone, and the lower timeframe QMR pattern are my major confluences for this sentiment.
Analyst’s Expectations:
Direction: Bearish
Target: $2,353.82
Invalidation: $2,410.53
CONCLUSION
The trading of CFDs comes at a risk. Thus, to succeed, you have to manage risks properly. To avoid costly mistakes while you look to trade these opportunities, be sure to do your due diligence and manage your risk appropriately.
You can access more of such trade ideas and prompt market updates on the telegram channel.
