Value at Risk (VaR)
What is Value at Risk (VaR)?
Value at risk (VaR) is a statistic that represents possible financial losses within a firm, portfolio, or position over a specific period. Investment and commercial banks most commonly use this metric to assess financial risks.
Understanding Value at Risk (VaR)
VaR modeling measures the amount of potential loss, the probability of its occurrence, and the timeframe.
A VaR assessment helps determine the cumulative risks from the organization’s positions. Using the data provided by VaR modeling, financial institutions can decide whether they have sufficient capital reserves to cover losses or whether higher-than-acceptable risks require them to make changes in their portfolio and choose investments with lower risk.
Marginal Value at Risk (MVaR)
The marginal value at risk (MVaR) method is the amount of additional risk that is brought by a new investment in the portfolio. MVaR helps managers understand the risk change in a portfolio due to the subtraction or addition of a particular investment.
An investment may have a high Value at Risk. However, if it negatively correlates with the portfolio, it may contribute a relatively much lower amount of risk to the portfolio than its standalone risk.
How Value at Risk is calculated
There are three main ways of calculating VaR: the historical method, the parametric method, and the Monte Carlo Simulation. Each has its calculations, advantages, and disadvantages related to complexity, calculation speed, applicability to certain financial instruments, and other factors.
1. Historical method
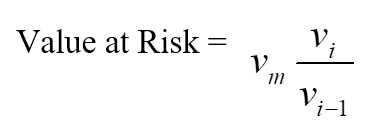
The historical method is the simplest method for calculating Value at Risk. Market data for the last 100 days is taken to calculate the percentage change for each risk factor on each day. Each percentage change is then calculated with current market values to present 100 scenarios for future value.
For each scenario, the portfolio is valued using full, non-linear pricing models. The fifth worst day selected is assumed to be 95% VaR.

Where:
- vi is the number of variables on day i,
- m is the number of days, from which historical data is taken.
2. Parametric method
The parametric method is also known as the variance-covariance method. It assumes a normal distribution in returns. Two factors are estimated: an expected return and a standard deviation.
The parametric method best suits risk measurement problems where the distributions are known and reliably estimated. The method is unreliable when the sample size is very small.
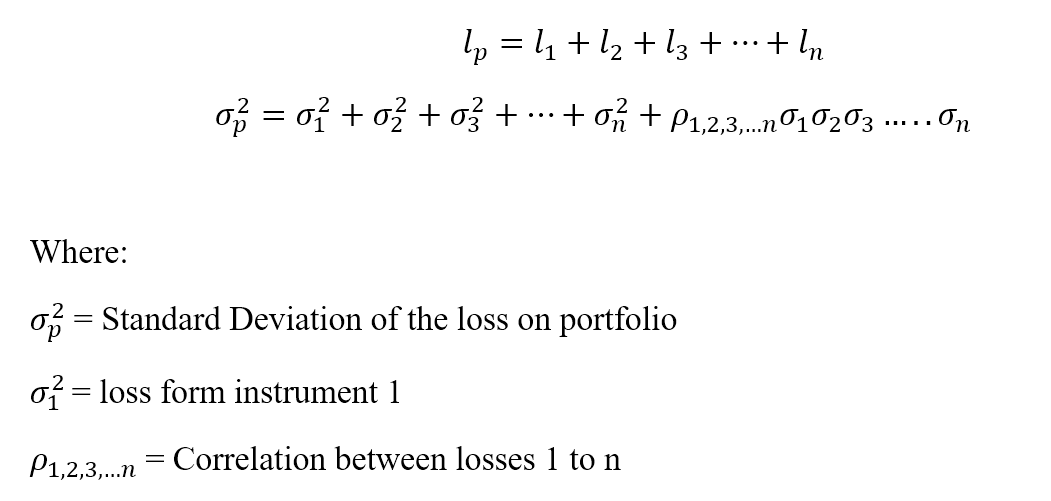
Let loss be ‘l’ for a portfolio ‘p’ with ‘n’ number of instruments.

3. Monte Carlo method
Under the Monte Carlo method, Value at Risk is calculated by randomly creating scenarios for future rates using non-linear pricing models to estimate the change in value for each scenario, then calculating the VaR according to the worst losses.
The Monte Carlo method is suitable for many risk measurement problems, especially when dealing with complicated factors. It assumes that there is a known probability allocation for risk factors.
VaR Example
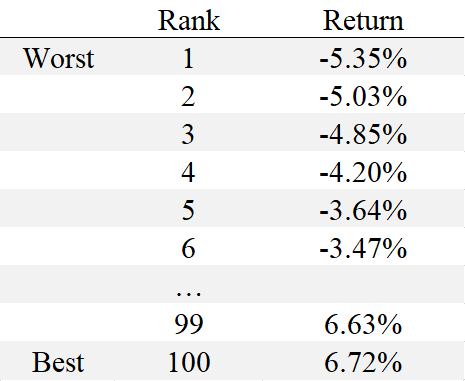
Suppose a risk manager wants to calculate the 1-day 95% VaR for stock XYZ using 100 days of data. Using the historical method, the risk manager would look at the last 100 days of returns for stock XYZ in order from worst to best. If we have the following 100 returns, sorted from lowest to highest:

In this case, the 95th percentile VaR corresponds to -3.64%, or the risk manager could say that the one-day 95% VaR is a loss of 3.64%. If this amount of risk is within an acceptable range for the risk manager, then stock XYZ may be considered a good investment.
Advantages of Value at Risk (VaR)
1. Easy to understand
Value at Risk is a single number that indicates a portfolio's risk level. Value at Risk is measured either in price units or as a percentage, making the interpretation and understanding of VaR relatively simple.
2. Applicability
Value at Risk is applicable to all types of assets: bonds, shares, derivatives, currencies, etc. Thus, different financial institutions can use VaR to assess the profitability and risk of different investments.
3. Universal
The Value at Risk figure is widely used, making it an accepted standard in buying, selling, or recommending assets.
Limitations of Value at Risk
1. Large portfolios
Calculating Value at Risk for a portfolio requires calculating the risk and return of each asset and the correlations between them. Thus, the greater the number or diversity of assets in a portfolio, the more difficult it is to calculate VaR.
2. Difference in methods
Different approaches to calculating VaR can lead to different results for the same portfolio.
3. Assumptions
Calculation of VaR requires making some assumptions and using them as inputs. If the assumptions aren’t valid, then VaR will be wrong.
Conclusion
Portfolio management of a company is a complex process that requires constant improvement of skills. For successful trading in the Forex market, a trader should follow risk management rules, such as position sizing, diversification, and limiting losses by placing Stop Loss orders, trading with leverage, etc. Fortunately, FBS offers a wide range of learning materials to help a trader of any level, from beginner to experienced, to improve their trading results.