Oil prices fell for a fifth straight session due to global demand concerns, despite a dip in U.S. fuel inventories. WTI and Brent futures have dropped by 6.9% and 6.4%, respectively, since August 15, pressured by weak economic data from the U.S. and China, as well as fears of OPEC+ reversing output cuts. In natural gas markets, prices are finding support near $2.15, with resistance at $2.21 being a key pivot point. WTI Crude shows support near $71.40 with a potential bullish reversal if prices break above this level. Brent Oil remains bearish below $76.50, with resistance levels at $78.19 and $79.33.
XBRUSD – D1 Timeframe
.png)
Brent (XBRUSD) as seen on the Daily timeframe chart attached above, has been on a steady decline for a few weeks, with the most recent impulse coming off the 50 and 200-day moving averages. Based on the recent break below the previous low, there’s increased likelihood of a continuation of the bearish movement. To this end, the horizontal pivot lines are my target.
Analyst’s Expectations:
Direction: Bearish
Target: 64.81
Invalidation: 82.00
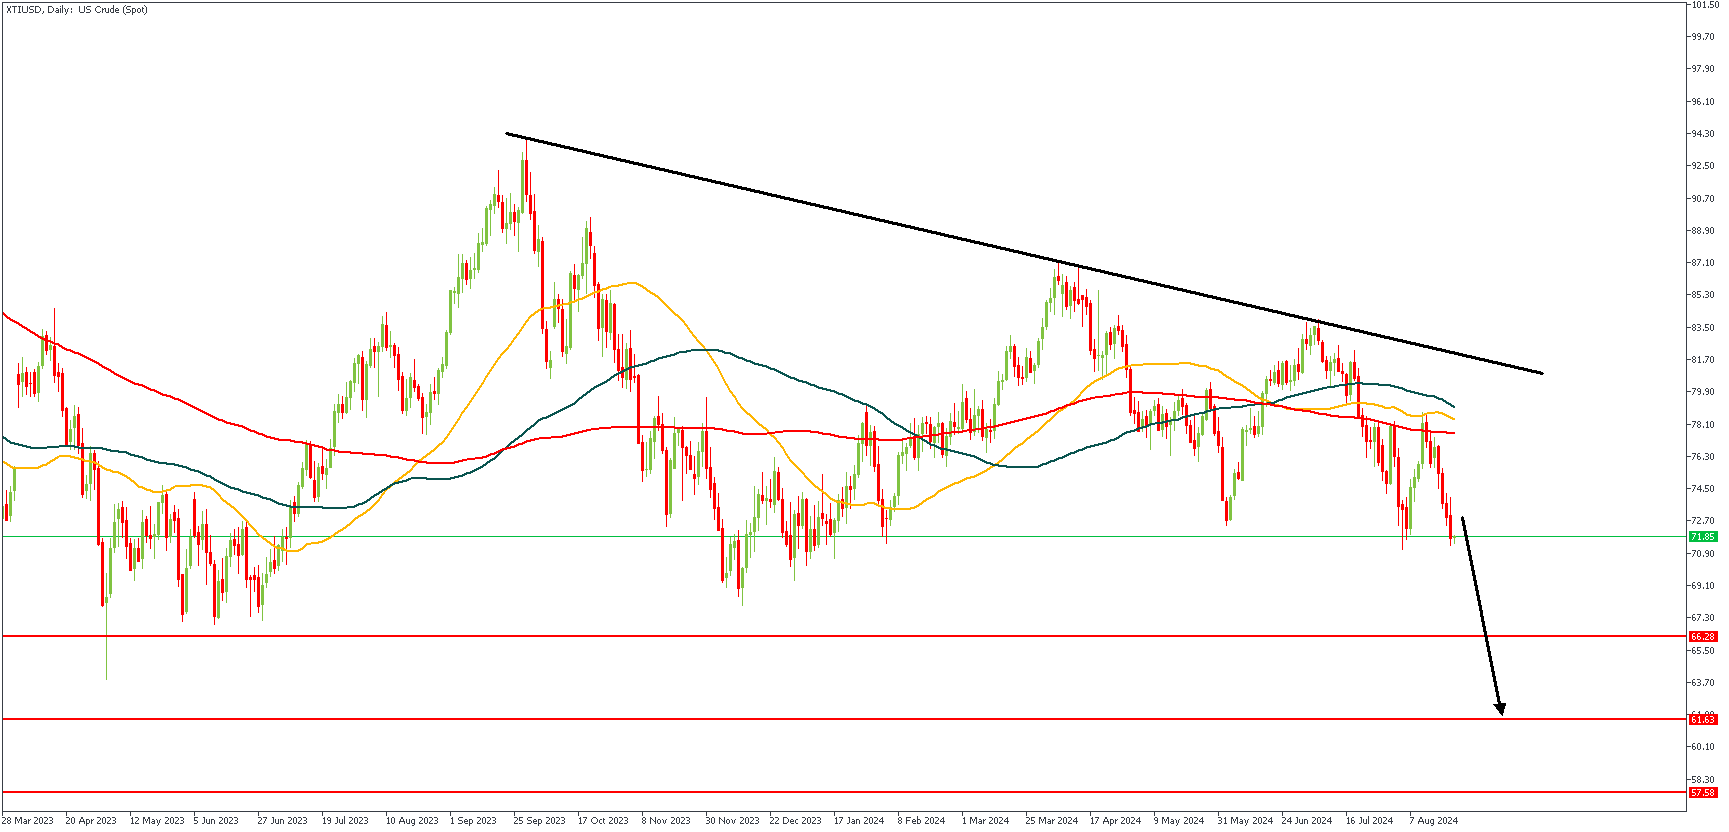
XTIUSD – D1 Timeframe

XTIUSD is also on a bearish run following its bounce off the trendline resistance, and the 200-day moving average resistance. In the light of this, and based on a mutual correlation with Brent as shown above, I am convinced price is bound for the horizontal red lines in search of a reliable support.
Analyst’s Expectations:
Direction: Bearish
Target: 61.63
Invalidation: 78.20
CONCLUSION
You can access more of such trade ideas and prompt market updates on the telegram channel.


