Fundamental Analysis
- Key Ideas This Week:
The inauguration of Donald Trump as President of the United States could influence economic and tech policies, impacting the Nasdaq 100. - Quarterly earnings reports from major tech companies like Netflix and Texas Instruments are expected, potentially affecting the index.
- Economic data, such as the Composite PMI and Consumer Confidence Index, will be released, offering insights into economic health and potential market movements.
Technical Analysis
US100, H4

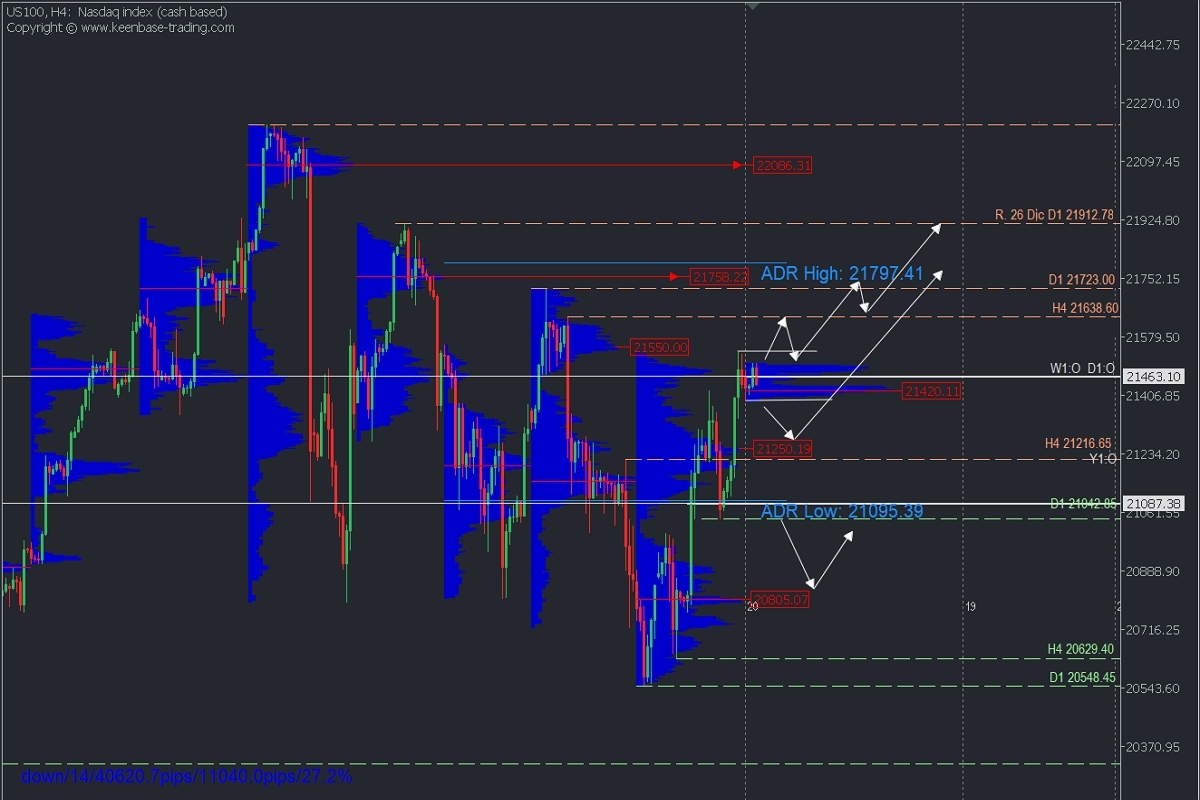
- Supply Zones (Sell): 21545, 21758, and 22081
Demand Zones (Buy): 21429, 21253, and 21199.35
The index remains within a daily downtrend, with the last validated resistance at 21723. However, the intraday chart has already produced a bullish reversal by breaking the local resistance at 21216.65 and confirming it with two ascending highs. This leaves a key intraday support at 21042.85. This reversal scenario offers an opportunity to restart the daily uptrend, provided the retracement does not break below the 21042.85 support.
Regarding volume structure, the price is trading above last week’s demand zones near 21247.50 and the uncovered POC* at 20805.07 but below supply zones such as 21550, 21758, and 22086.
In this context, there is a volume concentration below the weekly opening around 21422, with a moderate bearish reaction to the supply zone around 21550, with a wide volume node. This suggests that the next bullish impulse will likely target resistances at 21638 and 21723.
However, if the price drops below the volume zone from the first sessions, we will have a clear bearish signal, implying selling towards the last demand zones around 21250, from which a new price rally towards the target resistances can be expected.
- Technical Summary
Bearish Scenario: Short positions below 21429 with TPs at 21400, 21350, 21300, and 21355 in the short term, from where buying can resume. - Bullish Scenario: Buy positions above 21255 or, more aggressively, after breaking (in a second ascent) last week’s resistance with TPs at 21638 and 21723.
Always wait for the formation and confirmation of an Exhaustion/Reversal Pattern (ERP) on the M5 timeframe, like the ones shown here https://t.me/spanishfbs/2258, before entering trades at the key zones indicated.
*POC: Point of Control — The level or zone with the highest concentration of volume. If a downward move follows it, it’s considered a sell zone (resistance). Conversely, if it preceded an upward move, it’s considered a buy zone (support), often located at lows and forming support zones.


