Open account
Open accountLog In
Open account

June 07, 2024

Trade ideas

USDCHF: Bullish Hidden Divergence

USDCHF, Daily

USDCHFDaily.png

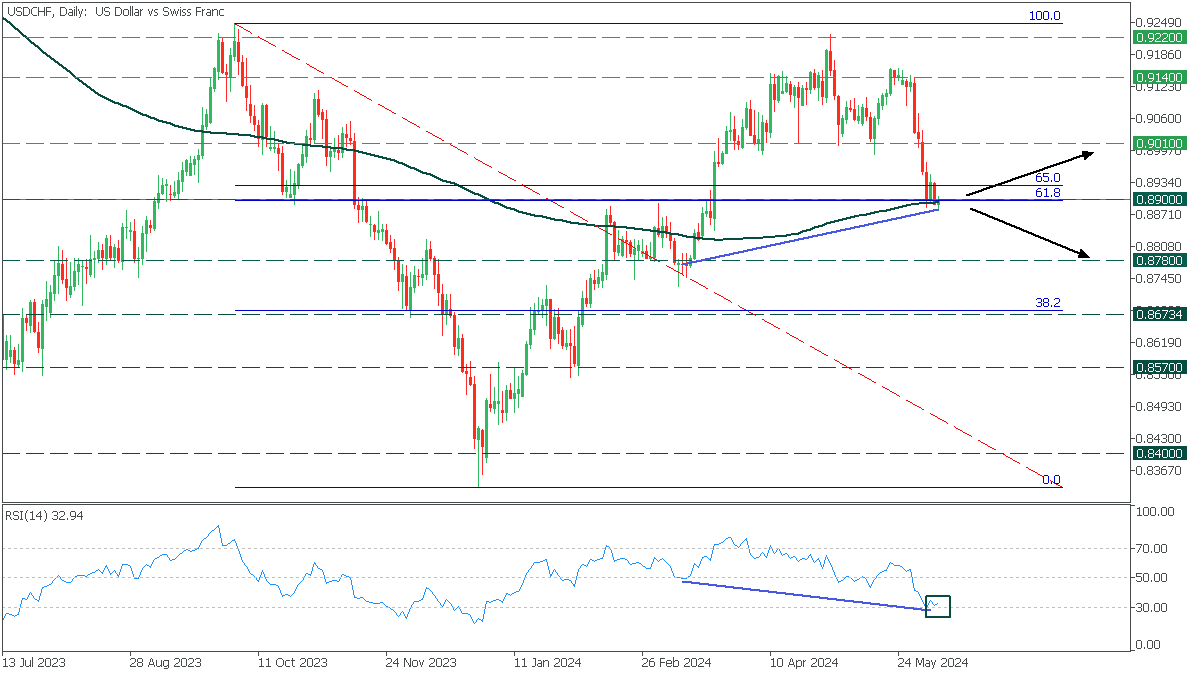
In the Daily time frame, the USDCHF faced a crucial support zone at the 0.8900 level, aligned with the golden Fibonacci ratio. The 200-MA gives extra support for the asset, and the RSI oscillator shows a bullish hidden divergence with the asset, signaling a potential bullish momentum for the asset.

  • If the price rebounds from the 0.8900 level, it will likely rise to the 0.9010 resistance.
  • However, if the USDCHF breaches below the support zone, it may trigger a decline to 0.8780.

Conclusion

In conclusion, trading CFDs carries inherent risks. Success in this field demands effective risk management. To minimize costly errors and capitalize on trading opportunities, it's crucial to conduct thorough due diligence and manage risks diligently.

TRY TRADING NOW

Share with friends:
Timur Yurdagyul

Author: Timur Yurdagyul

Open an FBS account

By registering, you accept FBS Customer Agreement conditions and FBS Privacy Policy and assume all risks inherent with trading operations on the world financial markets.

FBS at social media

iconhover iconiconhover iconiconhover iconiconhover icon

Contact us

iconhover iconiconhover iconiconhover iconiconhover icon
store iconstore icon
Get on the
Google Play
store iconstore icon
Get MT4 on the
App Store
store iconstore icon
Get MT5 on the
App Store

Trading

Company

About FBS

Our social impact

Legal documents

Company news

FC Leicester City

Help Center