Open account
Open accountLog In
Open account

Oct 30, 2025

Strategy

What Is the Hanging Man Candlestick Pattern and How Do You Trade It?

In this article

Hanging Man Candlestick simple steps to trade it, examples

Sometimes it can be difficult for beginners to understand when to sell or buy assets. Experienced traders analyze trading signals and technical indicators for this purpose, such as candlestick patterns that show that the market will rise or fall soon. One such candlestick pattern is the Hanging Man — a pattern that appears in a bullish market as a harbinger of a transition to a bearish trend.

The Hanging Man candlestick’s meaning and significance

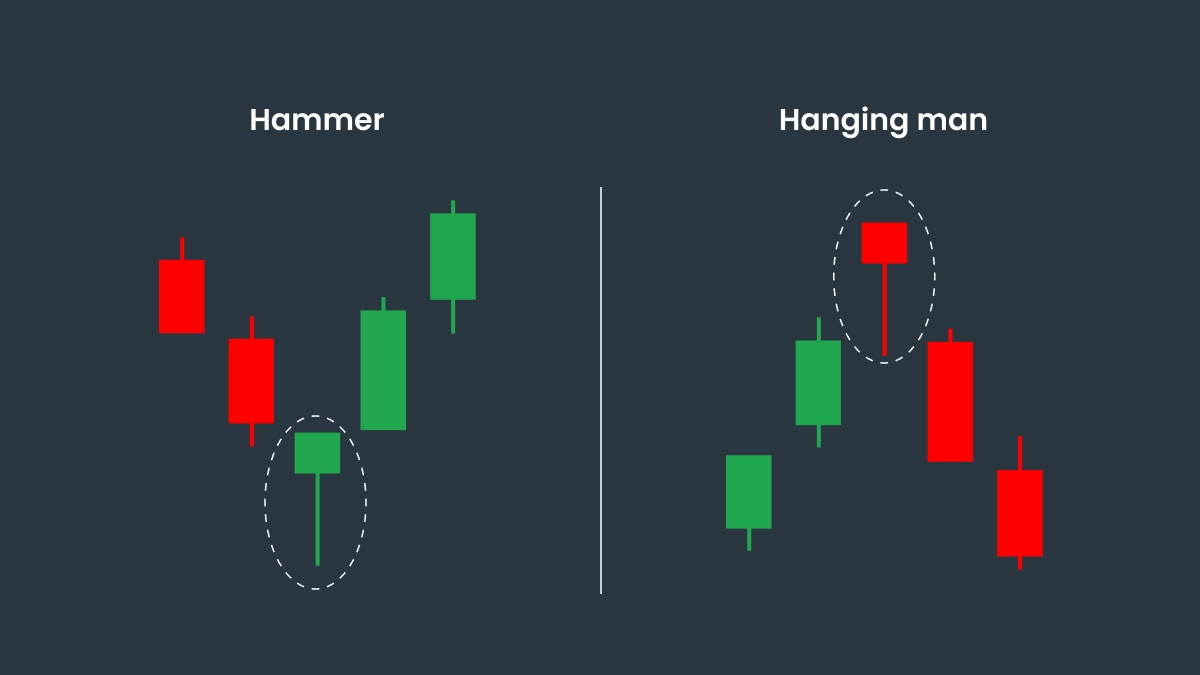
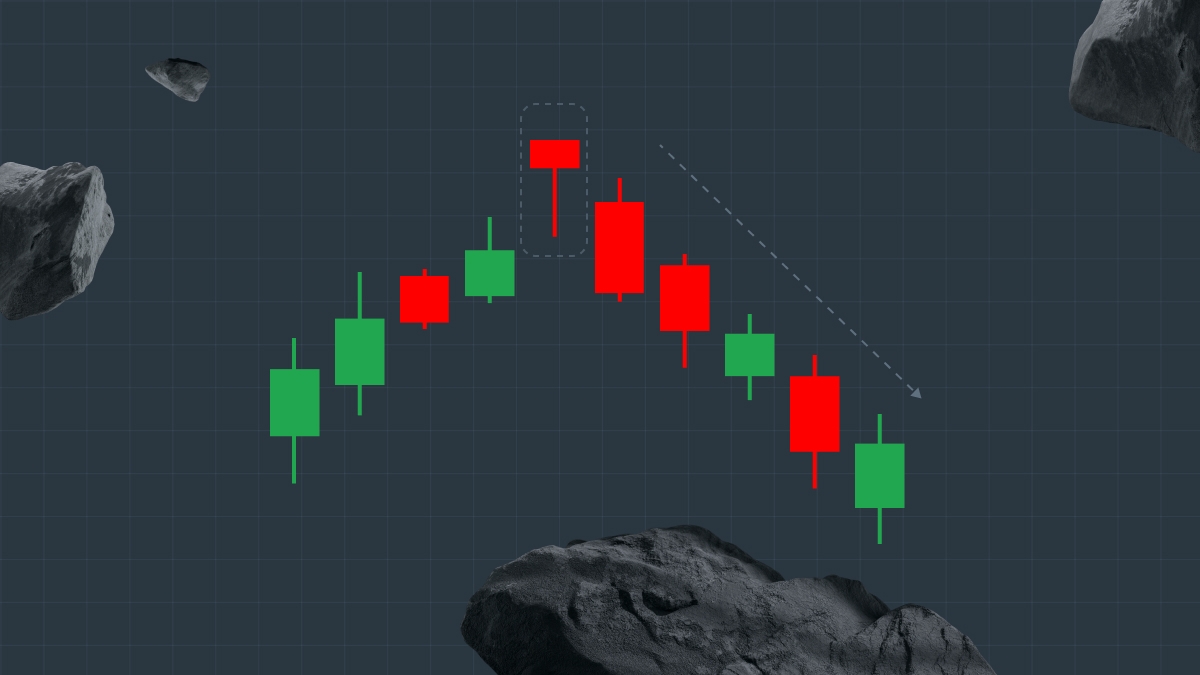
The Hanging Man is a pattern that appears at the peak of an uptrend. It serves as a warning sign that the market is about to reverse and fall.

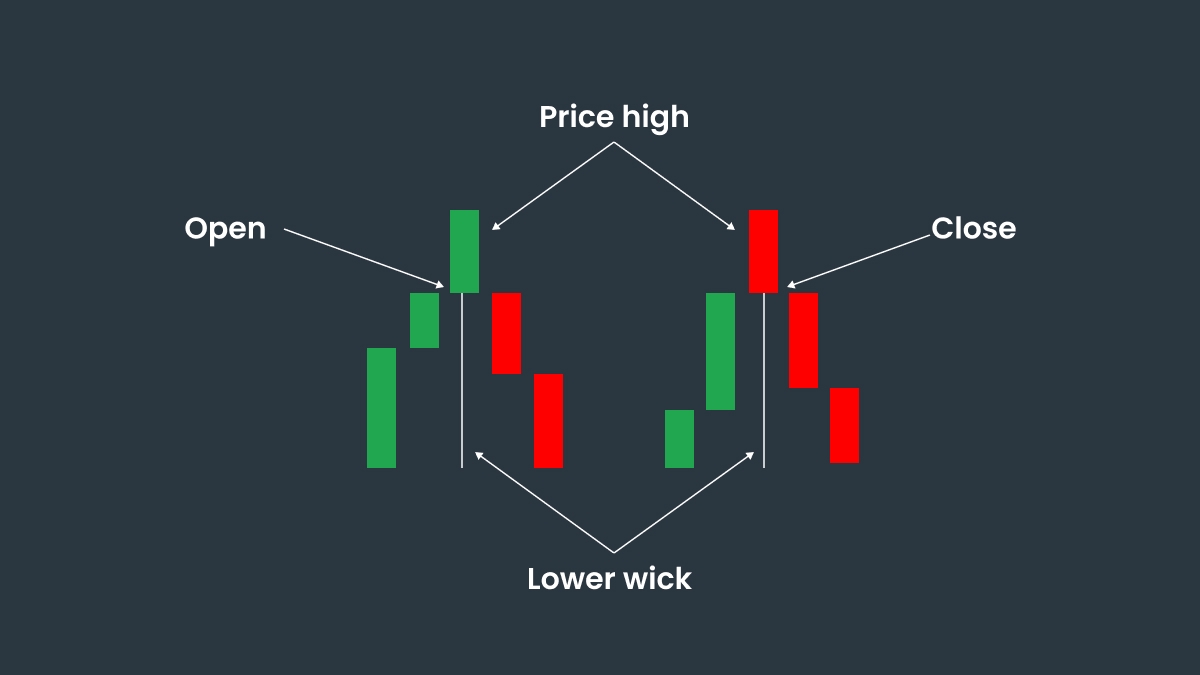
The Hanging Man candle is characterized by a small body and a long shadow (a wick). The long shadow means that during the session the price fell significantly, and the small body indicates that it recovered to the same level as before the opening of the session.

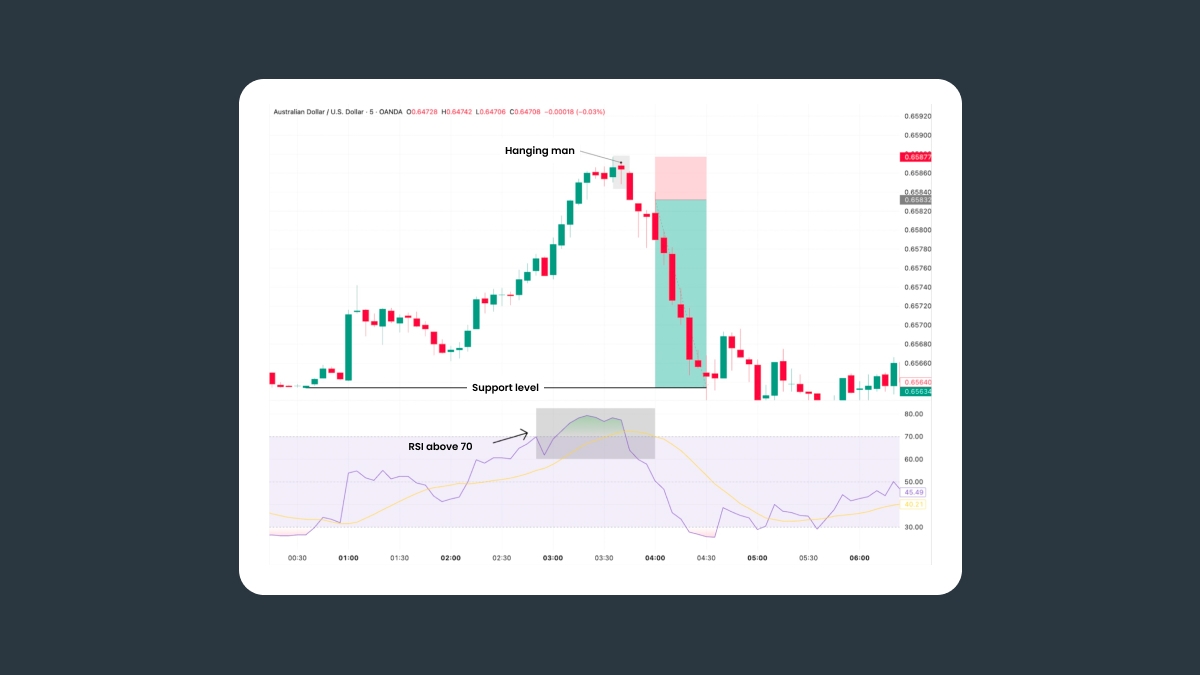
This pattern gets its name from the visual resemblance to a figure with long legs. The Hanging Man candle is not so alarming at first glance because the price has not fallen sharply. But the long shadow is a key indicator that sellers were dominating during the session and that the current trend was weak. A bearish candle after the Hanging Man will confirm that hypothesis. The pattern is especially significant after a long rally or near resistance levels.

Candle psychology

To understand why the Hanging Man can warn of a reversal, look at what happens during that candle. At first, buyers push the price higher, showing the uptrend is still in swing. But as trading goes on, sellers start to take over and push the price down sharply. By the candle's close, buyers recover some of that drop, but not enough to show real strength. The small body and long lower shadow reveal a market losing momentum. The signal tends to be stronger after a clear uptrend or near a resistance level, and weaker when volume is low or the market is moving sideways.

To identify the Hanging Man, look for these three signs:

1. A candlestick with a short body and a long wick.

2. The candlestick is at the peak of an uptrend.

3. A bearish candlestick after the Hanging Man.

Identification criteria

For a candle to qualify as a Hanging Man, it needs to meet specific shape requirements. These rules help distinguish it from ordinary candles with long wicks:

  • The lower shadow should be at least twice the length of the real body. This long lower wick shows that sellers pushed the price down sharply before buyers managed to pull it back up.

  • The real body should be small and near the top of the range. This means the open and close are close together and near the session’s high.

  • There should be little to no upper shadow. A small upper wick is okay, but a long one weakens the pattern.

  • It must occur after an uptrend. Without a prior bullish move, the Hanging Man loses its meaning as a reversal warning.

Hanging Man identification checklist

  • Lower shadow: At least twice as long as the body.

  • Body: Small and near the top of the candle’s range.

  • Upper shadow: Little to none.

  • Appearance: After a clear uptrend.

  • Next candle: Closes below the Hanging Man’s low for confirmation.

Red vs green Hanging Man

There are two types of Hanging Man candlestick: red and green. A red Hanging Man means that the price closed below where it opened and sellers are dominating. A green Hanging Man means that the price is higher than the opening one and buyers have taken control by the end.

A red one is considered a warning, like a yellow traffic light. The green one, however, requires more observation and increased attention.

Red vs green Hanging Man

The difference between a Hanging Man and a Hammer candlestick

The difference between a Hanging Man and a Hammer candlestick

A pattern that is often mistaken for a Hanging Man is theHammer. The decisive factor in distinguishing them is the place of appearance.

• The Hanging Man appears at the peak of the chart after prices have risen and signals a possible market decline.

• The Hammer appears after prices have fallen and foretells the end of a bearish market. The Hammer occurs if sellers have lowered prices and buyers have intervened and raised them up. That trend means the market will start to grow.

To avoid mistaking a Hammer for a Hanging Man, pay attention to the trend leading up to the candlestick.

PatternAppears afterWick directionPossible signal
Hanging ManUptrendLower wickBearish reversal
HammerDowntrendUpper wickBullish reversal

Inverted Hanging Man candles

Some people distinguish a pattern where the wick is located above the body of the candlestick. They call it an Inverted Hanging Man. However, this definition is not generally accepted in technical analysis. Some people confuse this pattern with a Shooting Star, which is formed after an uptrend, and has a long upper shadow and a small body at the base, while the lower shadow is either absent or small. Never call this pattern an Inverted Hanging Man.

Comparison of Similar Candlestick Patterns


PatternSignal typeContextMeaning
Hanging ManBearish reversalAfter uptrend

- Sellers pushed prices down but buyers stepped in (long lower wick).

- Shows weakening buying pressure and possible trend exhaustion.

Shooting StarBearish reversalAfter uptrend

- Buyers pushed the price higher but sellers fought back and closed near the low.

- Signals strong rejection of higher prices.

- Potential start of a downward move.

HammerBullish reversalAfter downtrend

- Sellers pushed the price lower but buyers fought back and closed near the high.

- Suggests downtrend may be ending as demand returns.

Inverted HammerBullish reversal (weaker signal, needs extra confirmation)After downtrend

- Buyers pushed the price higher but couldn’t hold it (long upper wick).

- Shows early buying interest.

- The next candle must confirm upward momentum.

Comparison of Similar Candlestick Patterns

Occurs only in uptrends

How do you know when to pay attention to the Hanging Man and when to ignore the signal?

A Hanging Man is a reversal signal that appears only after an uptrend.

It doesn’t mean anything if you see it form in a downtrend or sideways market. While the validity of candlestick patterns depends on many factors, like market conditions, timeframe, and other technical indicators, analysts consider the Hanging Man pattern to be a fairly reliable tool for determining market reversals, especially when combined with indicators.

Here’s when you should pay attention to the Hanging Man pattern.

1The Hanging Man forms after 3 to 5 green candles.
2The Hanging Man appears after the price reaches the resistance level on the chart.
3You see other confirmations, such as an overbought RSI.

Invalidation and filters checklist:

Here’s when you should ignore the pattern:

  • There’s no clear prior uptrend or only sideways movement.

  • The candle has a long upper shadow.

  • It forms on low trading volume.

  • The body appears in the middle of the recent price range rather than near the top.

Timeframes and session context

Higher timeframes

The Hanging Man tends to be more reliable on higher timeframes like the 4-hour or daily charts. These candles capture a bigger picture of the market’s movement, so you get a stronger, clearer signal of what buyers and sellers are really doing.

Shorter timeframes

On shorter charts like the 5-minute or 15-minute, you’ll see the pattern a lot, but most of those signals won't be valid. Short timeframes are noisy, and that noise can be mistaken for a setup.

Session timing

The time at which it forms matters too. In Forex, a Hanging Man that forms near the end of the London or New York session is more meaningful than one that appears during slower hours. For stocks or indices, a gap up followed by a Hanging Man near resistance is often a bearish signal and warns that momentum may be fading.

In an unstable market, the Hanging Man is unreliable.

How to trade the hanging man candlestick pattern

Here’s how to trade using the Hanging Man candlestick. Do not rely on it alone. The pattern must be used in conjunction with other indicators, such as RSI, for additional confirmation.

  1. Finding the trend and pattern. Find a candlestick with a small body and a long shadow. This is only relevant in an uptrend market.

  2. Entry. Wait for confirmation when the next candlestick closes below the low of the Hanging Man. If this happens, open a sell position just below the next bearish candle.

  3. Stop-loss. Set a stop-loss just above the high of the Hanging Man. If the body of the Hanging Man pattern is small, you can set the stop-loss based on the risk/reward ratio of the last resistance level.

  4. Target. There is no single method for setting a target profit for the Hanging Man pattern. You can use the risk/reward ratio, the next resistance level, or the previous low for the take-profit.

You can also lock in profits gradually. Once the trade reaches a good level, like two or three times your risk, you can take partial profits and then let the rest run. As the price keeps moving in your favor, you can also trail your stop above each new lower high to lock in gains while giving the trade room to develop.

Confirmation Rules

A single Hanging Man on its own isn’t enough to act on. Traders should wait for confirmation with the very next candle and look for additional confluence before entering.

Next candle confirmation

The most reliable signal is when the following candle closes lower, preferably with a strong bearish body. If the next candle starts lower than where the Hanging Man closed, that adds more weight to the case of a reversal.

Volume spike

Higher-than-average trading volume during the Hanging Man or the confirmation candle suggests that sellers are stepping in.

Support from other indicators

Trendlines, moving averages, and resistance zones near the pattern add credibility to the setup. If multiple signals align, the chance of a true reversal increases.

The risk/reward ratio is one of the most important things to keep in mind when trading. Read this article to learn all about it.

Risk and limitations of the pattern

Candlestick patterns have their drawbacks and the Hanging Man is no exception. Be mindful of these when using this pattern.

1. False and ambiguous signals. This pattern can appear even when the market continues to grow, especially if the uptrend is very strong. Green candles can give especially ambiguous signals.

2. Limited information. The Hanging Man is a one-sided pattern that gives traders limited information, so you must use additional tools to confirm the trend.

3. Low reliability on small volumes. The pattern does not work on small market volumes.

4. The pattern does not work in volatile markets. In volatile markets, the Hanging Man pattern is useless and signals nothing.

Real-world examples and chart illustrations

Here’s an example of a Hanging Man candlestick being used on the AUDUSD currency pair.

1. Entry conditions. The candlestick formed on an uptrend, ideally at a resistance level or close to the overbought zone; for example, at a resistance level around 0.65877. It was followed by a bearish candle, confirming that the sellers are in control.

2. RSI above 70. The RSI level above 70 indicates an overbought market and confirms the likelihood of a reversal.

3. Stop-loss. You open a short position and set a stop-loss just above the high of the Hanging Man candle; for example, at 0.66000. This will provide protection in case the market does not reverse.

4. Take-profit. The nearest support level is around 0.65531. The take-profit order is placed there.

Real-world examples and chart illustrations

Never use this pattern in isolation from other tools.

Glossary

Real body

The thick, colored part of the candlestick. It shows where the price opened and where it closed. When the body is small, the price didn’t move much during the session. A long body means buyers or sellers had strong control.

Shadow (wick)

The thin line above or below the body. It shows how far the price moved beyond the open and close.

Trend

The general direction the market is moving in. When it makes higher highs and higher lows it is called an uptrend. A downtrend is a stretch where the price keeps falling, making lower lows.

Confirmation candle

The candle that appears right after a pattern that adds weight to the signal.

Resistance level

A price area where an uptrend often slows down or reverses because many traders start selling there.

Support level

A zone where a downtrend often stops falling since buyers begin stepping in.

FAQ: Hanging Man candlestick pattern

Does the color matter?Not much. Both red and green Hanging Man candles can be valid. A red one is often seen as stronger, but the key factors are shadow length, body position, and confirmation — not color alone.

How often does it appear?It shows up fairly often, but most cases are weak or invalid. Focus only on those that appear after a clear uptrend and at resistance levels.

Is it profitable on its own?No. Like all candlestick patterns, the Hanging Man works best when combined with confirmation (next candle close, volume, RSI, trendlines). Using it in isolation leads to many false signals.

How reliable is it compared to other patterns?It’s a useful warning sign but not the strongest reversal pattern. Reliability improves on higher timeframes (H4/D1) and when paired with other confluence tools.

Share with friends:

FBS at social media

iconhover iconiconhover iconiconhover iconiconhover icon

Contact us

iconhover iconiconhover iconiconhover iconiconhover icon
store iconstore icon
Get on the
Google Play
store iconstore icon
Get MT4 on the
App Store
store iconstore icon
Get MT5 on the
App Store

Trading

Company

About FBS

Our social impact

Legal documents

Company news

FC Leicester City

Help Center

Partnership programs