FAQ
What is the difference between a hammer candle and an inverted hammer?
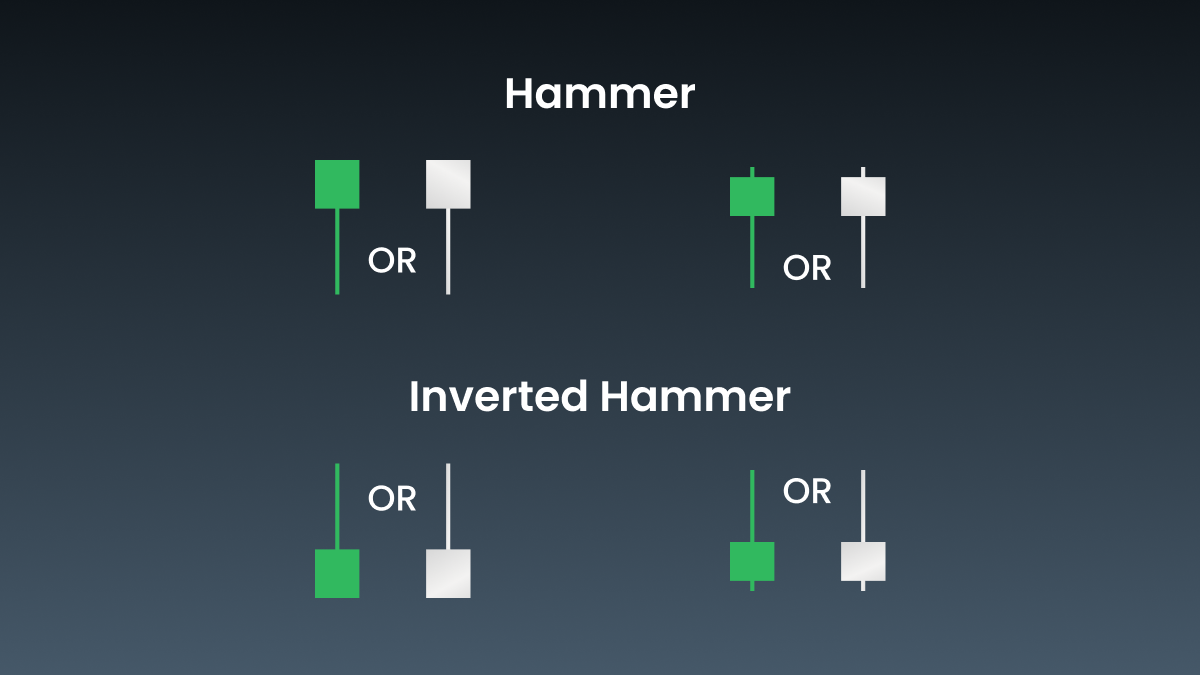
An inverted hammer is a candlestick pattern that suggests a potential trend reversal. The inverted hammer candle looks like a hammer, but upside down: it features a long upper shadow instead of a lower one, while its body remains small and stays at the bottom of the trading range. This pattern indicates that buyers tried to push the price higher after a large drop, hit some resistance, and created a potential reversal signal that must be confirmed by the next price move. However, an inverted hammer best identifies bullish reversals at a downtrend’s end.
How can I identify a hammer candle formation?
It’s essential to be able to identify a hammer candle formation. Thanks to its recognizable look, it is arguably one of the easiest candlestick patterns to identify.
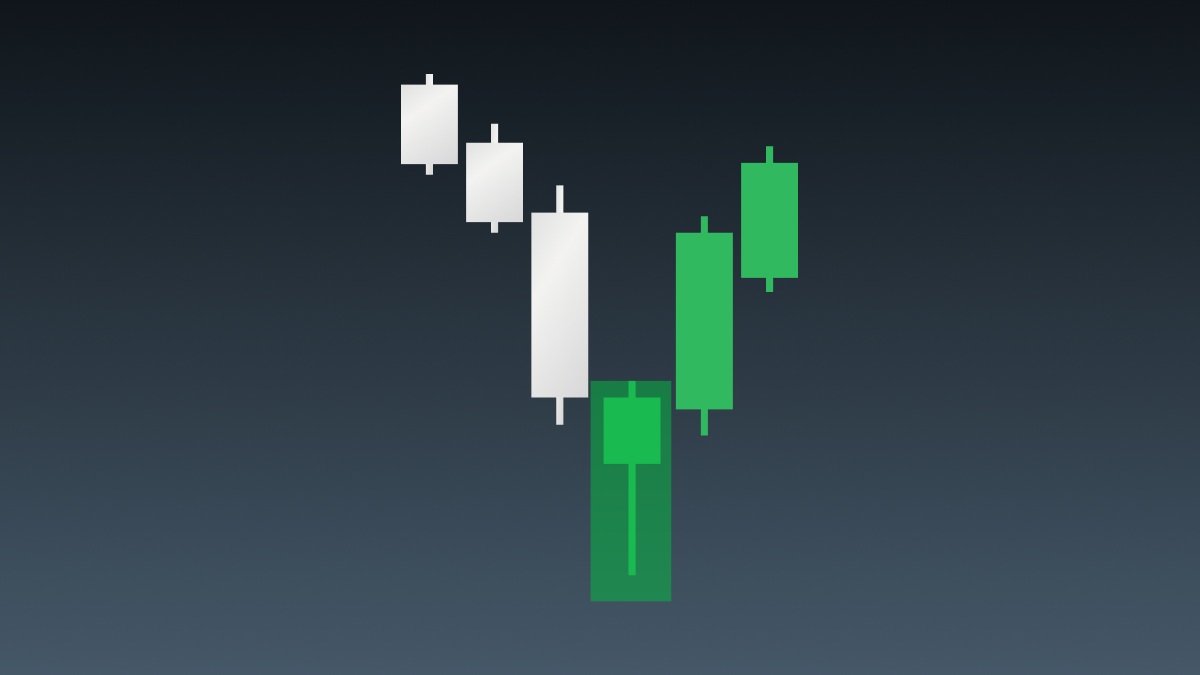
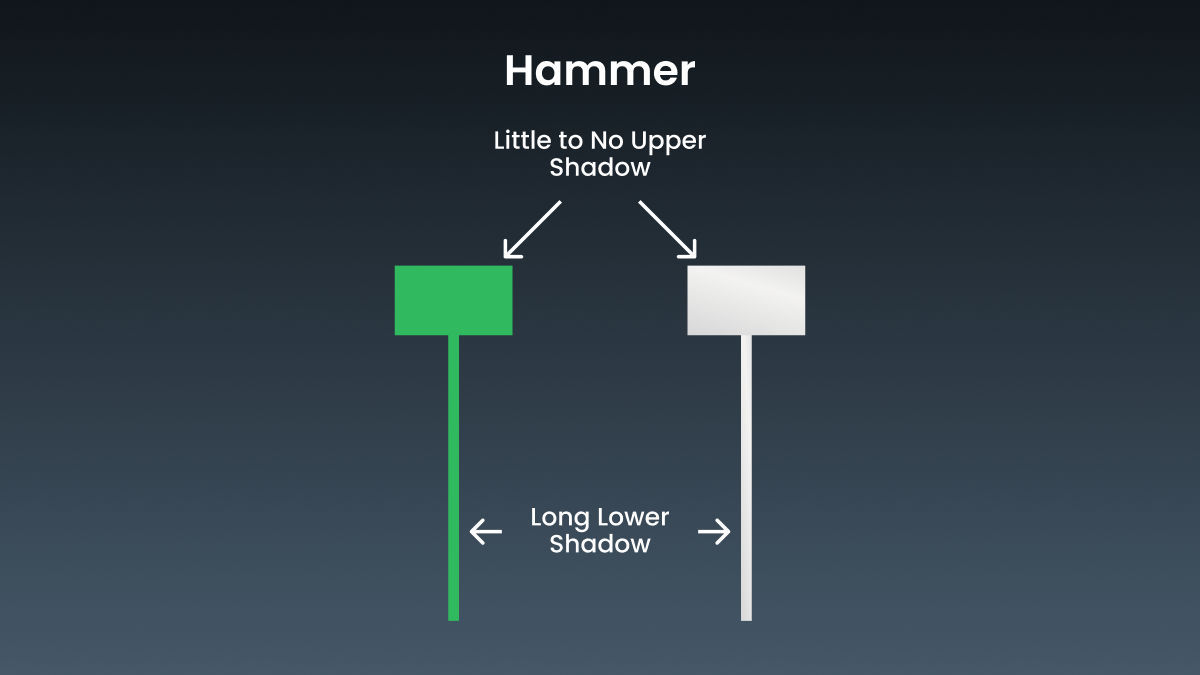
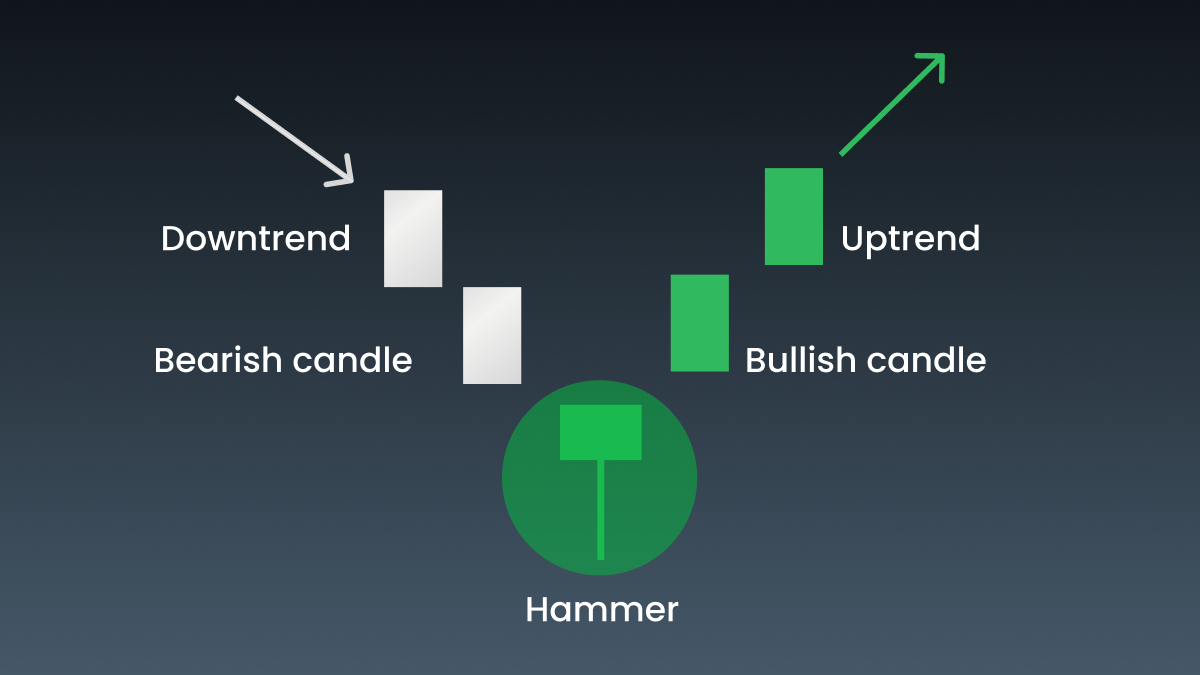
A small body near the top of the candle with a long lower shadow that’s at least twice the length of the body, signaling rejection of lower prices. Little to no upper shadow, emphasizing buying pressure after an initial price drop. A bullish reversal confirmation, especially when seen at key support levels or when combined with additional indicators, like increased trading volume.
What are the best trading strategies for hammer candles?
The best strategies for trading with a hammer candle pattern revolve around confirming the reversal signal using additional indicators or levels to enhance reliability. One of the effective strategies that you can employ is as follows:
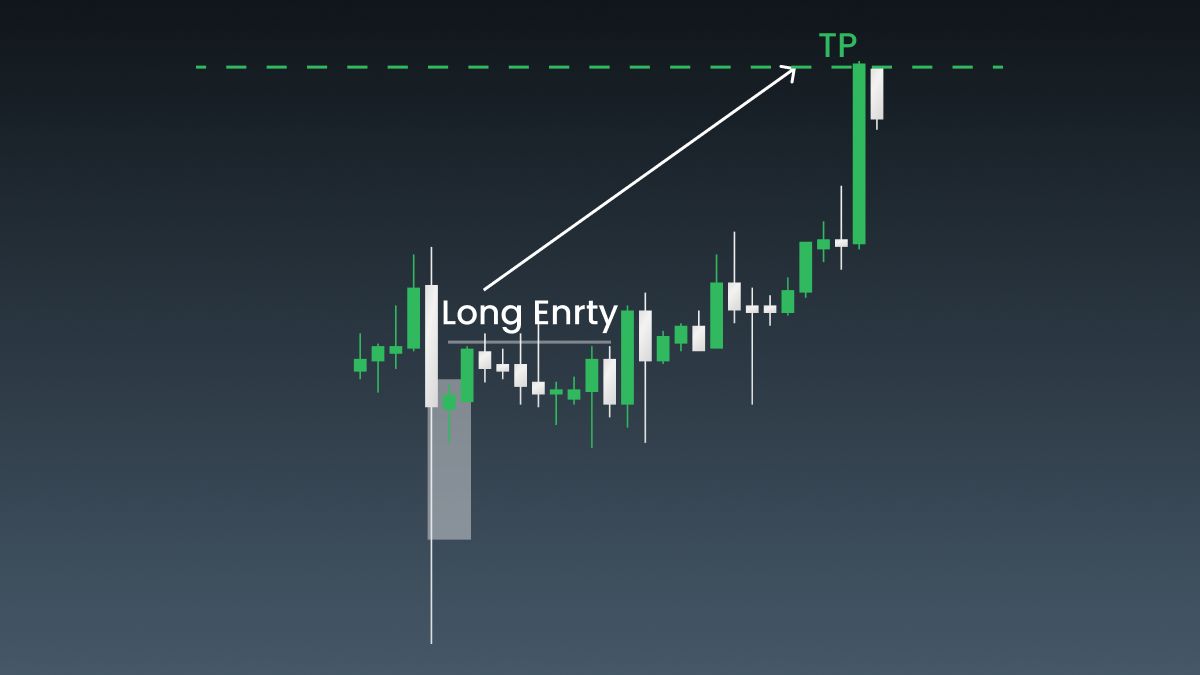
Hammer with support levels is an effective strategy that revolves around identifying key support levels where the price has previously rebounded. When a hammer pattern forms around these levels, it often signals a potential reversal. A long position can be considered once the price breaks above the hammer’s high, with a stop-loss placed below the hammer’s low for risk management.
Combining the hammer with moving averages can also be used to confirm hammer signals. In a powerful uptrend, let the price pull back first toward a moving average, such as the 50-day line. A hammer forming in that area often presents a signal of trend resumption. A rally above the high of the hammer might trigger an entry, in which case a stop-loss should be placed below its low.
Hammer with RSI divergence, as the RSI allows the signals given by the hammer to be refined by identifying divergences. One would look for new price lows while the RSI is making higher lows, which indicates a bullish divergence. When a hammer appears in this scenario, it serves as a confirmation that strengthens the reversal, and indicates that a long position may be opened with a stop-loss set barely below the hammer’s low.
You can read more about effective hammer candle strategies in the article above.
Are there specific timeframes better suited for trading hammer candles?
The hammer candle can be applied across all markets and timeframes, from intraday charts to daily and weekly charts. The indicator becomes all the more crucial when the market becomes highly volatile, and price swings become prominent. For example, in a downtrend of the EURUSD forex pair, a hammer candle may signal a reversal, pushing traders who maintain proper risk management measures to establish long positions.
The hammer pattern often appears after earnings reports or critical news events. A hammer candle may form when the stock has declined due to pessimistic sentiment, but an earnings report comes in better than expected. This could signal reverse growth, which traders can use to open a long position and wait until the stock’s price recovers.
How can I manage risk when trading with hammer candles?
Effective risk management is critical when trading on the hammer candlestick pattern. Most traders set a stop-loss just below the bottom of the hammer shadow. This will minimize losses if the market turns against the deal. Having a stop-loss at this strategic point enables the trader to save capital and provides opportunities for trading to develop.
For example, if EURUSD forms a hammer candle with at least one minimum price of 1.1000, then 1.0950 is a good place for the stop-loss. At that level, the order limits probable losses but allows for minor market fluctuations without unduly closing the position.
How different is a doji hammer dragonfly from a hammer candle?
Hammer and doji candles can signal potential reversals, but they also have key differences.
A hammer has a small body with a long lower shadow, showing a solid shift from selling to buying pressure. In contrast, a doji has a very small body with nearly equal shadows on both sides. Depending on what follows, a doji can suggest a reversal or continuation. Meanwhile, a hammer usually appears after a price drop and, if confirmed, points to a likely upward reversal, with its single, long lower shadow standing out.
The doji dragonfly and the hammer both signal potential bullish reversals at the end of downtrends, but they have different structures. The doji dragonfly has the same open and close prices, while the hammer features a small body near the top of the range, with slightly different open and close prices. For more accurate signals, both patterns should be combined with other indicators.
