
Oil markets initially fell on Thursday but rebounded after the U.S. Advance GDP numbers exceeded expectations, suggesting increased demand. West Texas Intermediate (WTI) crude dipped below $76 but turned around due to value hunting and demand optimism, facing resistance at $77.50 and $78. Brent crude also dropped below $80 but is attempting to recover, with potential resistance at $81.50 and $84. Traders are cautiously optimistic about a market rebound but remain aware of the recent volatility and the need to build positions slowly.
XBRUSD – D1 Timeframe
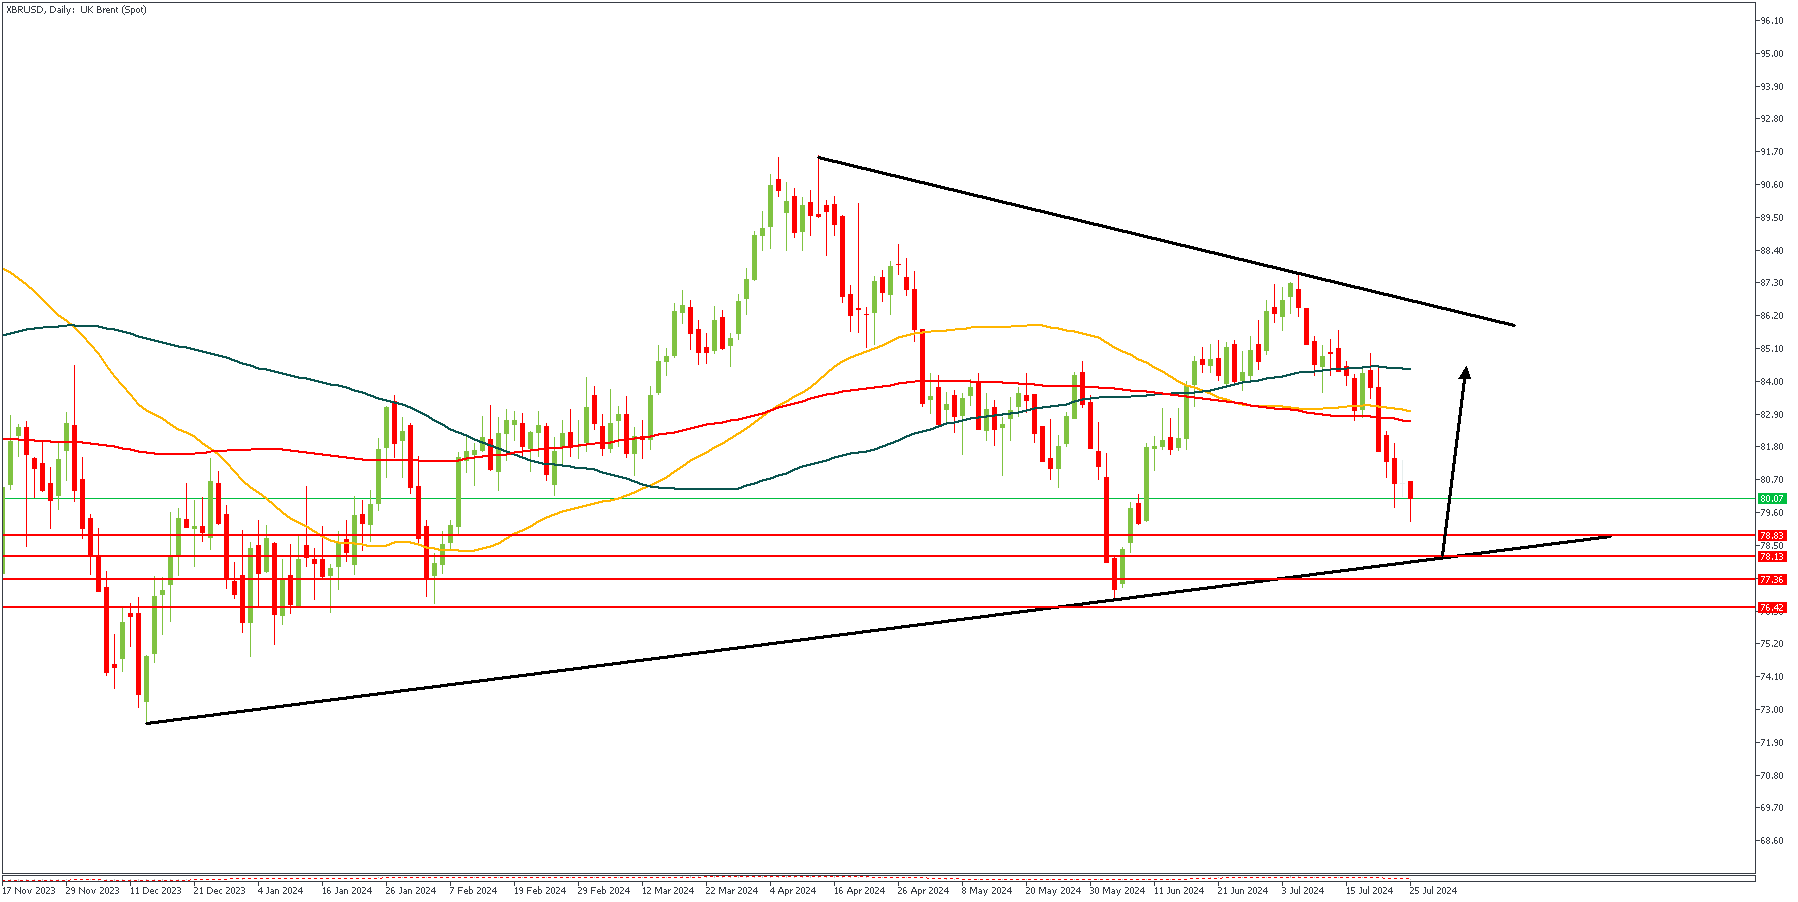
XBRUSD on the Daily timeframe is currently approaching the trendline support after having broke above the previous high initially. The area of retest aligns perfectly with the key Fibonacci retracement level, as well as the Daily timeframe pivot zone. The demand zone is also a crucial factor in favor of the bullish sentiment.
Analyst’s Expectations:
Direction: Bullish
Target: 85.20
Invalidation: 76.40
XTIUSD – D1 Timeframe
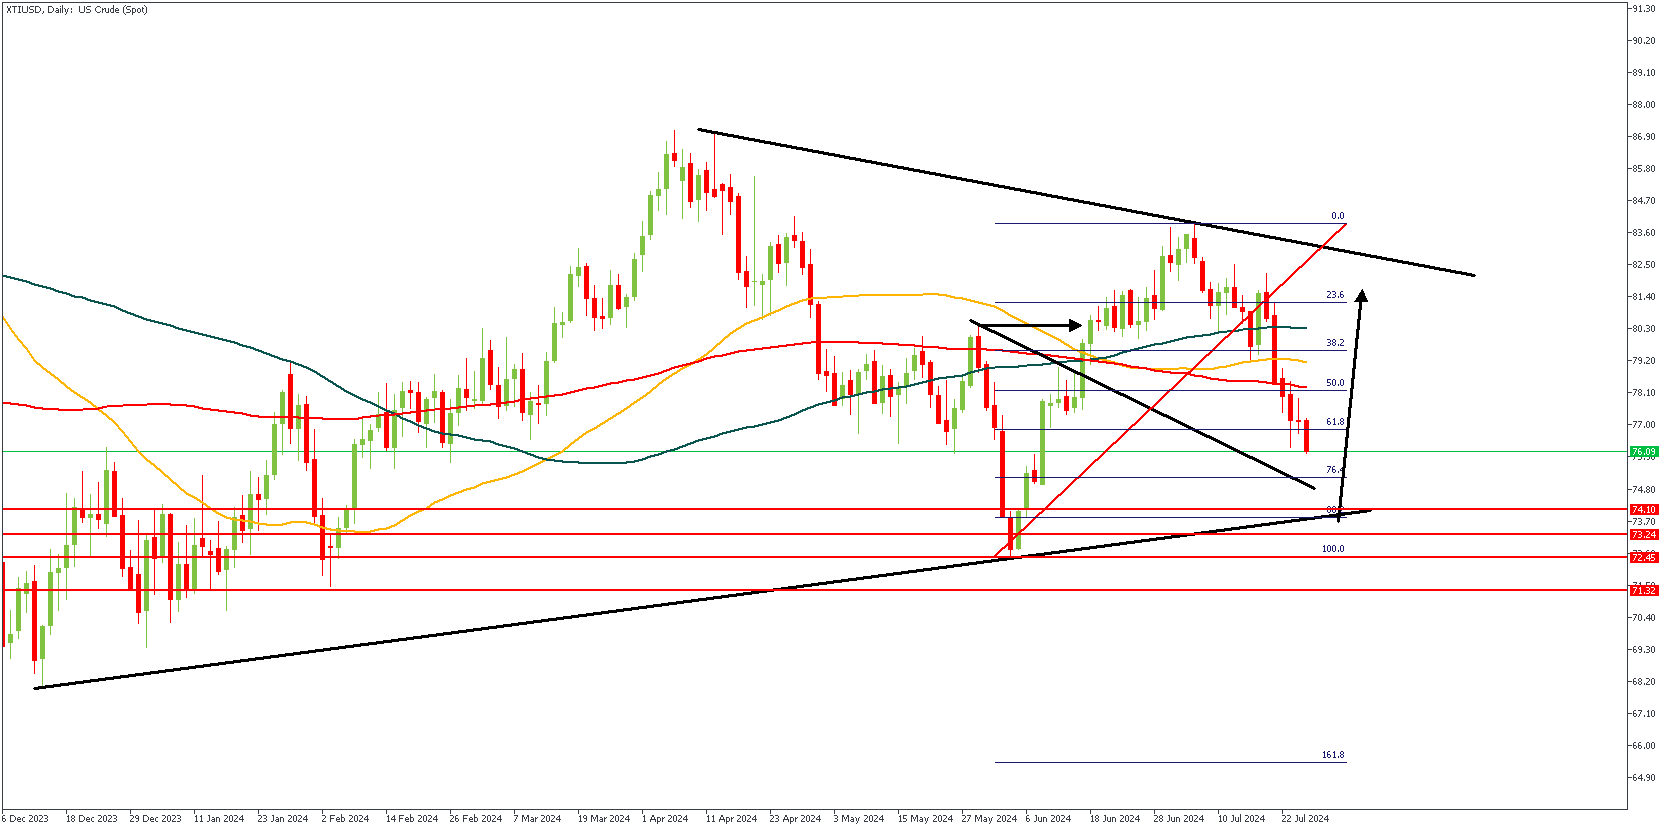
XTIUSD on the daily timeframe presents a similar case to the XBRUSD price action. In this case, we also have the 88% Fibonacci retracement level as a crucial area of interest, as well as the drop-base-rally demand zone. The trendline support is another confluence that can be considered in favor of the bullish market sentiment.
Analyst’s Expectations:
Direction: Bearish
Target: 81.20
Invalidation: 70.20
CONCLUSION
You can access more of such trade ideas and prompt market updates on the telegram channel.


