
The USDCAD surged to a high of 1.3845, marking its seventh consecutive gain after bouncing off the 200-day SMA near 1.3600, indicating potential for further gains. However, technical indicators suggest the market is overbought, with the stochastic showing a bearish crossover and the RSI falling below 70. A pullback might target immediate support at 1.3790 and 1.3755, with the bullish crossover of the 20- and 50-day SMAs around 1.3700 possibly halting deeper declines. Conversely, breaking above 1.3845 could face resistance at 1.3900, with further gains reaching 1.3975. Overall, while USDCAD has been bullish, a corrective move might be imminent.
AUDUSD – D1 Timeframe
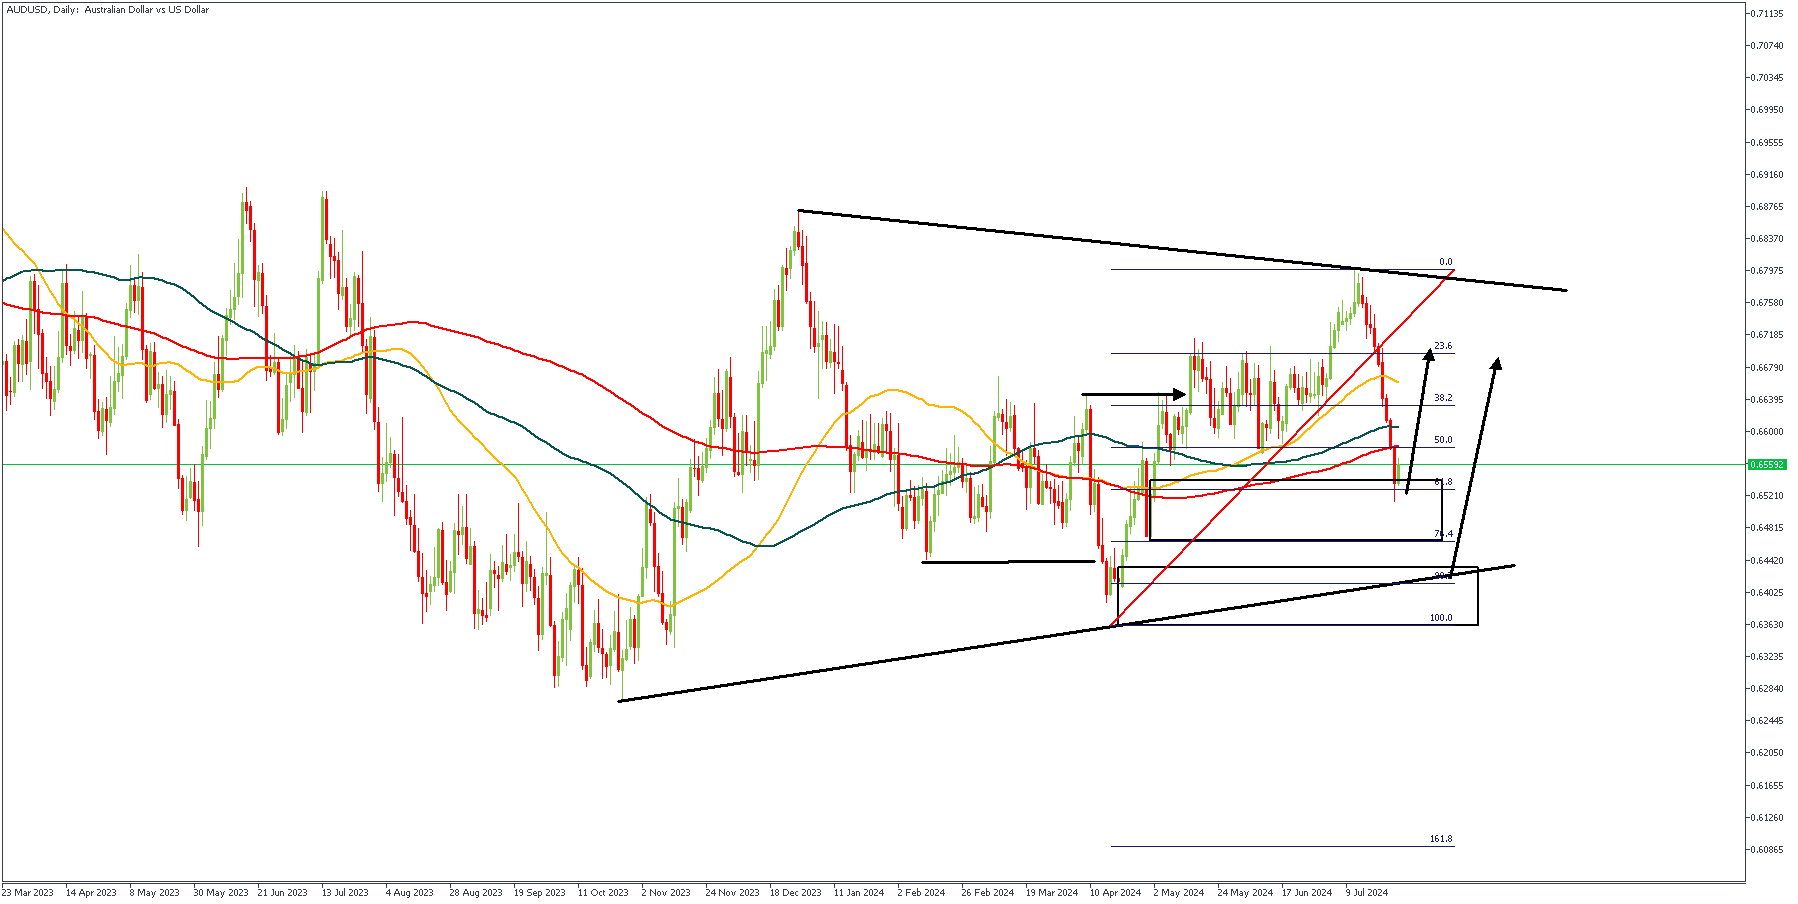
The massive decline in exchange rates for AUDUSD as deduced from the daily timeframe chart attached shows a decrease in the pace of the price action. This could be as a result of a reaction from the Daily timeframe demand zone, or the Golden ratio of the Fibonacci retracement tool. Whichever factor is responsible though, I have a secondary target at the trendline support for my bullish entry based on the SBR price action pattern, the 88% of the Fibonacci retracement (which is my personal preference), as well as the drop-base-rally demand zone.
Analyst’s Expectations:
Direction: Bullish
Target: 0.66950
Invalidation: 0.63390
USDCAD – D1 Timeframe
.png)
On the Daily timeframe chart of USDCAD, we can see that price has made an initial reaction off the Daily timeframe pivot zone and area of supply. However, since the moving averages are still in a bullish array, I would patiently wait for a critical change of character on the lower timeframes in order to confirm my bearish sentiment – as a way of minimizing my risk exposure. My overall sentiment though is bearish.
Analyst’s Expectations:
Direction: Bearish
Target: 1.36795
Invalidation: 1.39027
CONCLUSION
You can access more of such trade ideas and prompt market updates on the telegram channel.


