Fundamental Analysis
In the current context of the USDJPY pair, hovering around 152.08, upcoming U.S. data on initial jobless claims and the manufacturing and services PMIs will be pivotal in the next few hours.
If these reports continue to show strength, it's likely the Federal Reserve will maintain its hawkish stance, further boosting the dollar.
On the other hand, the U.S. Manufacturing PMI is expected at 47.5 and the Services PMI at 55.0—both critical indicators of economic activity.
Should the PMI data exceed expectations, it will reinforce the perception of a robust U.S. economy, potentially increasing dollar demand and pushing USDJPY higher.
However, a negative surprise in any of these indicators could trigger volatility and possibly lead to a correction in the pair.
Technical Analysis
U.S. Dollar Index (DXY), H2

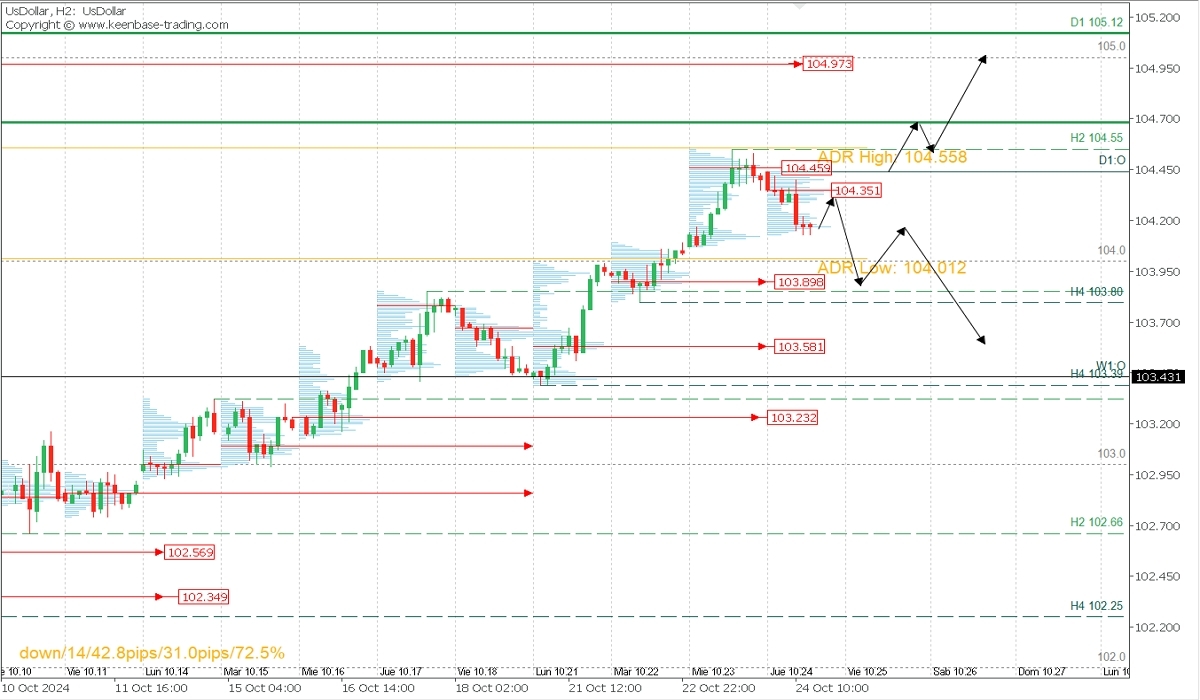
- Supply Zones (Sell): 104.35, 104.45, 104.97
- Demand Zones (Buy): 103.89, 103.58
The dollar index is correcting within a broad bullish expansion, leaving two volume clusters that form a supply zone between 104.35 and 104.45.
This zone offers ample liquidity for sellers, potentially extending sales toward 104.00 and 103.89 intraday. This is a local demand zone that could reactivate buying interest in the noted supply area.
If this sell zone halts the price advance, it could initiate a corrective phase, confirmed by a decisive break of the 103.80 support, the last validated intraday support, aiming for the uncovered POC* at 103.58, forming the next demand zone. However, if the price sees a more aggressive upward rally, decisively breaking through the key supply zone and the 104.55 resistance, the bullish trend could resume, with the next target being the supply zone around 105.00.
USDJPY, H2

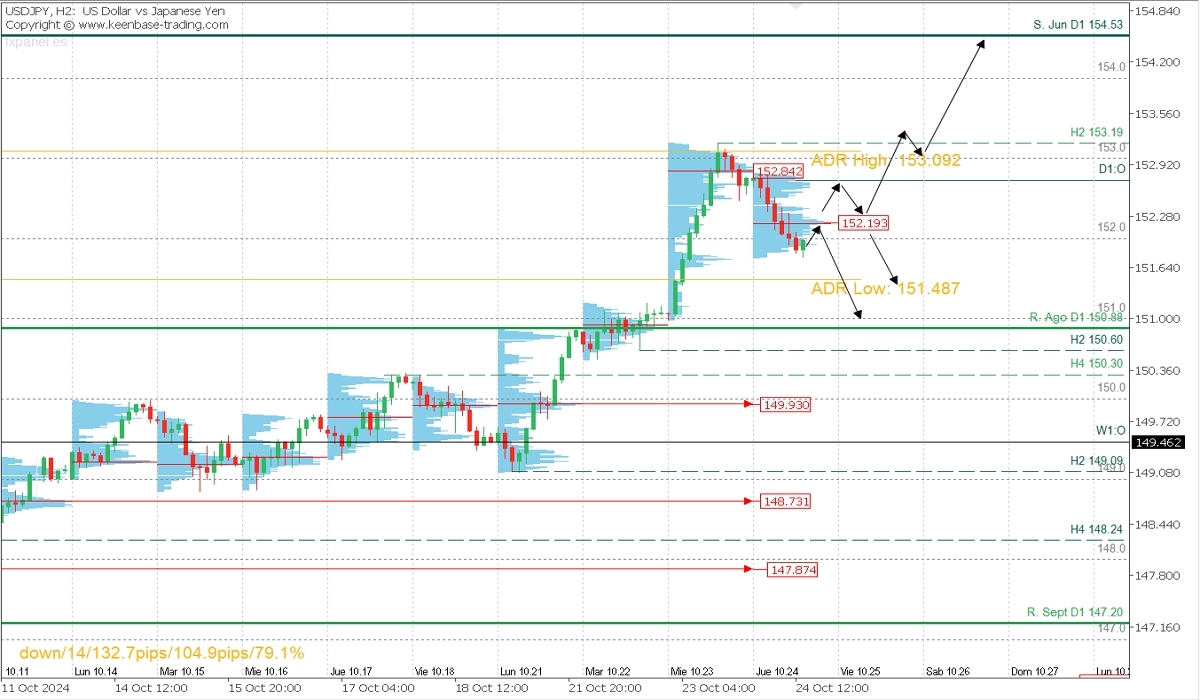
- Supply Zones (Sell): 152.84, 152.19
- Demand Zones (Buy): 150.92, 149.93
The USDJPY shows a technical structure similar to the dollar index, suggesting a broader correction may occur if the price stays below the supply zone around 152.84, with more momentum if it remains under 152.19. Daily targets include the bearish range at 151.48 and the demand zone near 151.00.
The last validated support of the trend is at 150.60, and as long as this level holds, the bullish trend remains intact.
Conversely, a more aggressive rally that breaks the local supply zone and breaches the 153.19 resistance will indicate a continuation of the uptrend toward 154.00 and 154.53.
Technical Summary
- Bearish corrective scenario: Intraday sells below 152.20 (after the formation and confirmation of a PAR*) with TPs at 151.48, 151.00, 150.60, 150.30, and 150.00 in extension. Use a 1% capital stop loss.
- Bullish continuation scenario: Buys above 152.50 (after a PAR* formation and confirmation) with TPs at 153.00, 153.20, 153.50, and 154.00 in extension. Use a 1% capital stop loss with low lot sizes for price movement.
Always wait for the formation and confirmation of a *Reversal Exhaustion Pattern (PER) on the M5 chart as taught [here](https://t.me/spanishfbs/2258) before entering trades in the key zones we’ve outlined.
*Uncovered POC: Point of Control (POC) refers to the level or zone where the highest volume concentration occurred. If a bearish move followed this level, it becomes a sell zone, forming resistance. If it followed a bullish move, it becomes a buy zone, usually found at price lows, thus forming support.
@2x.png?quality=90)


