AUDNZD – H4 Timeframe

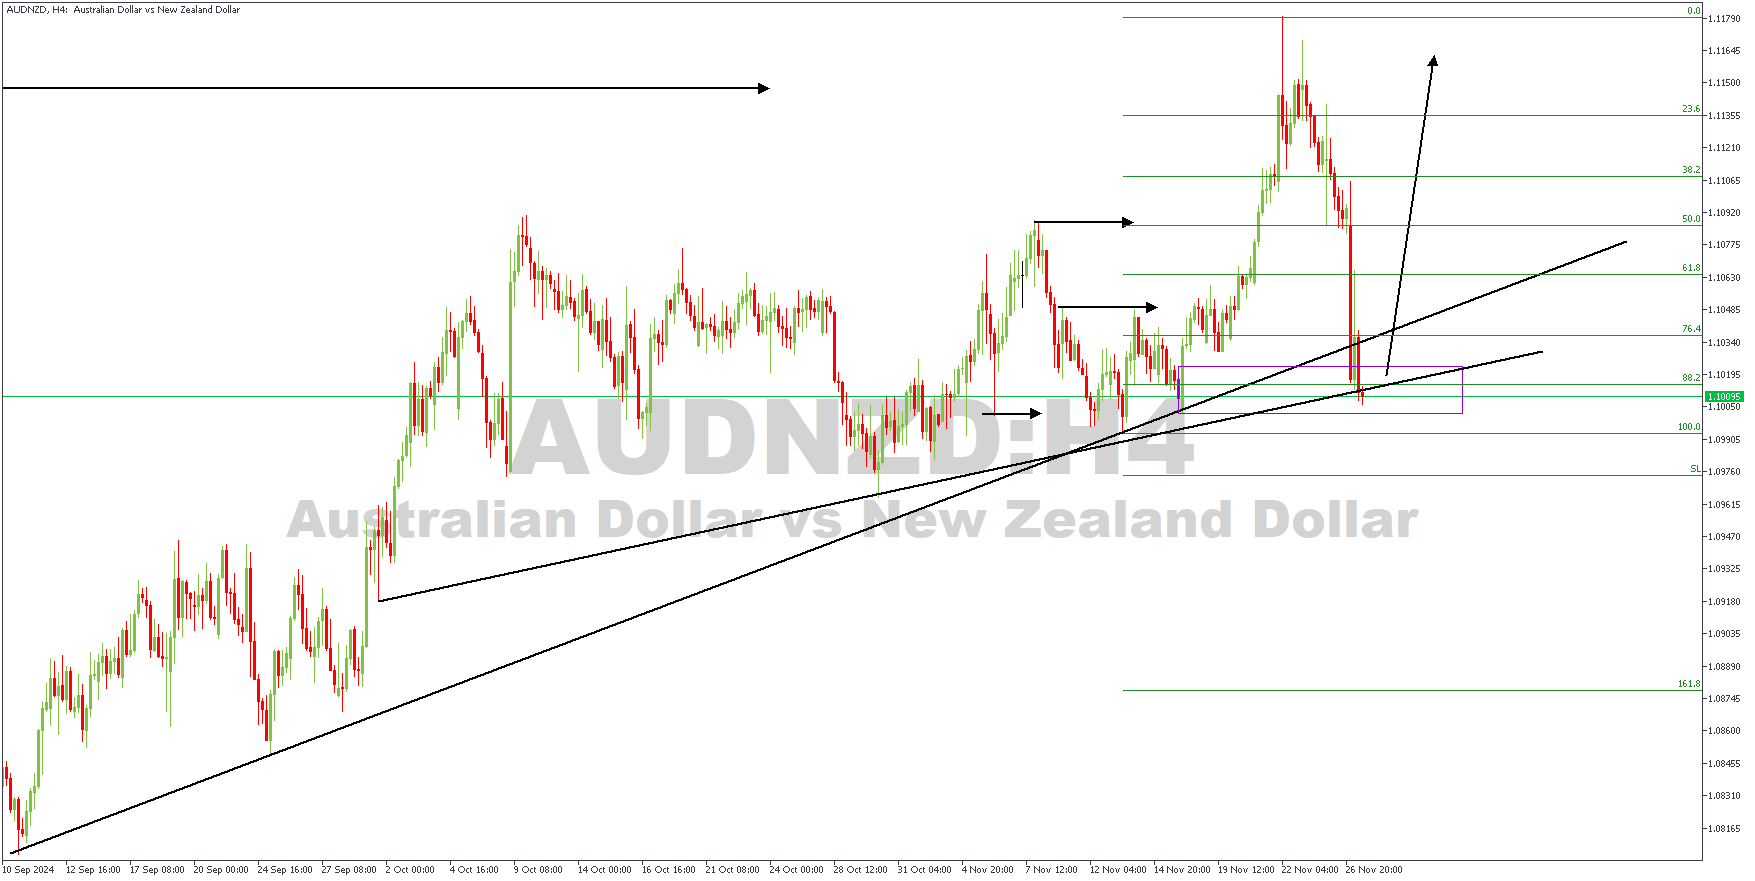
The 4-hour timeframe chart of the price action of AUDNZD shows a recent bullish break of structure, followed by a quick drop. The drop has since begun to stall, having encountered support at the drop-base-rally demand zone near the 88% Fibonacci retracement level. There is also a confluence of support trendlines within the price region and an inverted head-and-shoulder pattern, lending more credibility to the bullish sentiment. Again, the confluences are;
- Bullish market structure;
- Retest of the trendline support;
- The confluence of support trendlines;
- Drop-base-rally demand zone;
- 88% of the Fibonacci retracement.
Analyst’s Expectations:
Direction: Bullish
Target: 1.11345
Invalidation: 1.09833
