US500, H4

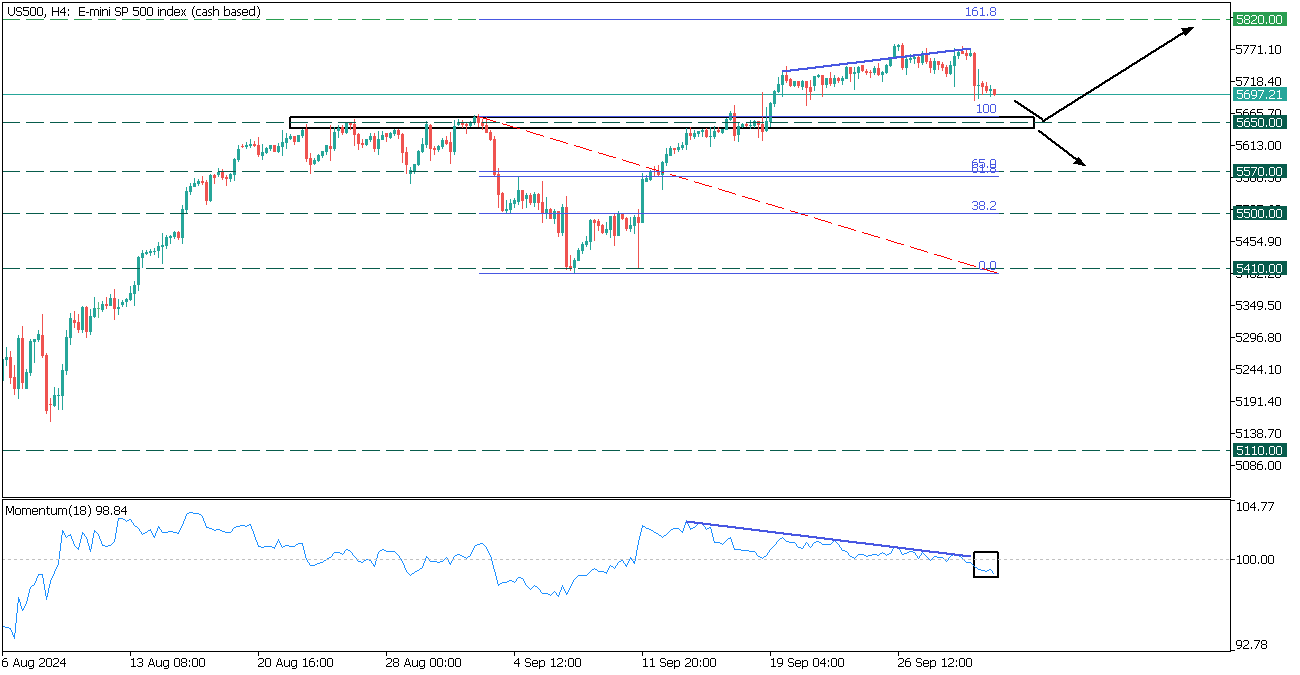
In the H4 timeframe, the US500 is in the correction after a bullish trend.
The Momentum oscillator shows a bearish divergence with the price and crosses the 100-line down, potentially indicating a bearish move for the asset.
- If the US500 rebounds from the 5650 support it will rise to 5820 and the 161.8 resistance;
- However, breaching below the 5650 support may trigger a decline to 5570 and the golden Fibonacci ratio.
