XAGUSD, H4
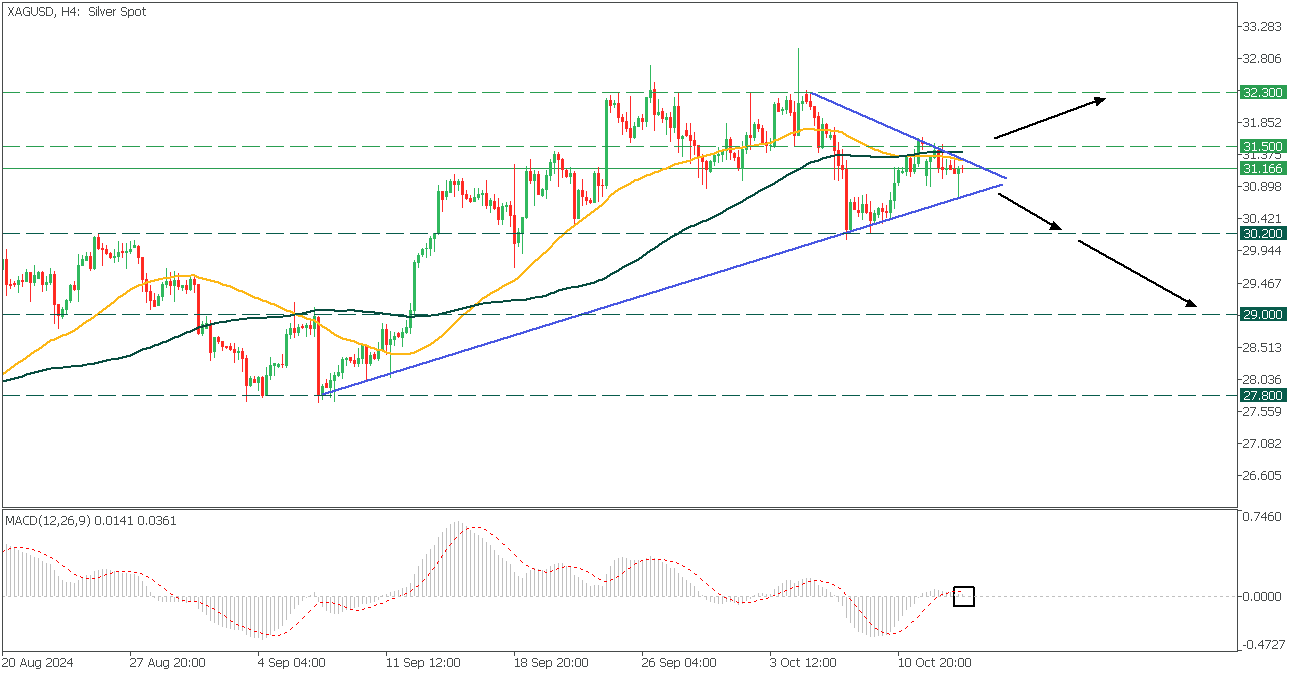
On the H4 timeframe, XAGUSD navigates within a symmetrical triangle and is sandwiched between two trendlines.
MACD histogram crosses the signal line and aims to cross the 0-line down. Also the 50-MA crosses the 100-MA downwards, giving a potential bearish sentiment.
- If the price breaks above the 31.50 resistance it will rise to 32.30 resistance;
- Breaching below the lower border will lead to a decline to 30.20. Further drop will bring the asset to 29.00.