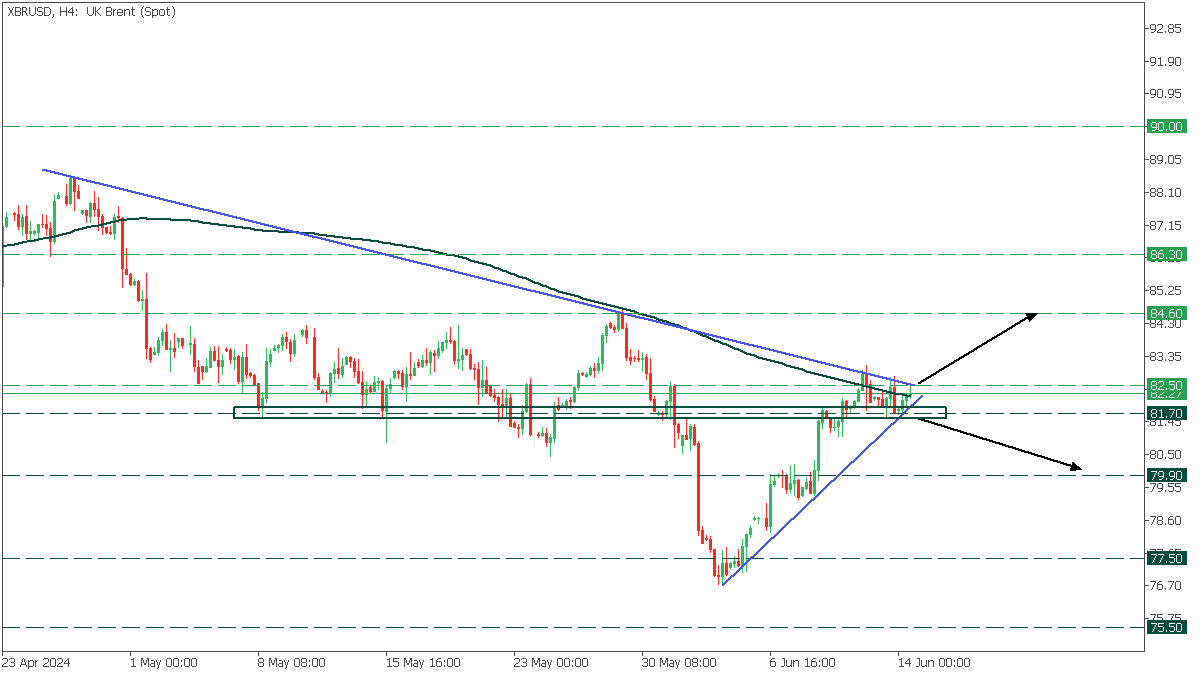
XBRUSD, H4

On the H4, XBRUSD is sandwiched between two trendlines, forming a symmetrical triangle. 200-MA adds another layer of resistance for the asset that gives us two scenarios:
- If the price breaks above the 82.50 resistance, it will rise toward the 84.60 level
- However, if XBRUSD falls below the 81.70 support level, it may decline to 79.90.
Conclusion
In conclusion, trading CFDs carries inherent risks. Success in this field demands effective risk management. To minimize costly errors and capitalize on trading opportunities, it's crucial to conduct thorough due diligence and manage risks diligently.
