

PIB dos EUA deve mostrar uma economia forte
A estimativa para os números finais é que o PIB do quarto trimestre se mantenha na casa dos 3,2%, mostrando uma economia aquecida
2024-03-27 • Atualizado
During the Asian session on Wednesday, the USDCAD pair rebounded after two days of losses, reaching around 1.3590. This uptick is fueled by a stronger US dollar and lower crude oil prices, which put pressure on the Canadian dollar. The decline in Western Texas Intermediate (WTI) oil prices to approximately $80.70 is attributed to a surplus in API Weekly Crude Oil Stock, indicating an oversupply. Bank of Canada (BoC) Senior Deputy Governor Carolyn Rogers raised concerns about Canada's low productivity and highlighted inflation concerns. Meanwhile, the US Dollar Index (DXY) rose amid a risk-off sentiment ahead of the US Personal Consumption Expenditures (PCE) release, but declining US Treasury yields suggest market expectations of potential rate cuts by the US Federal Reserve.
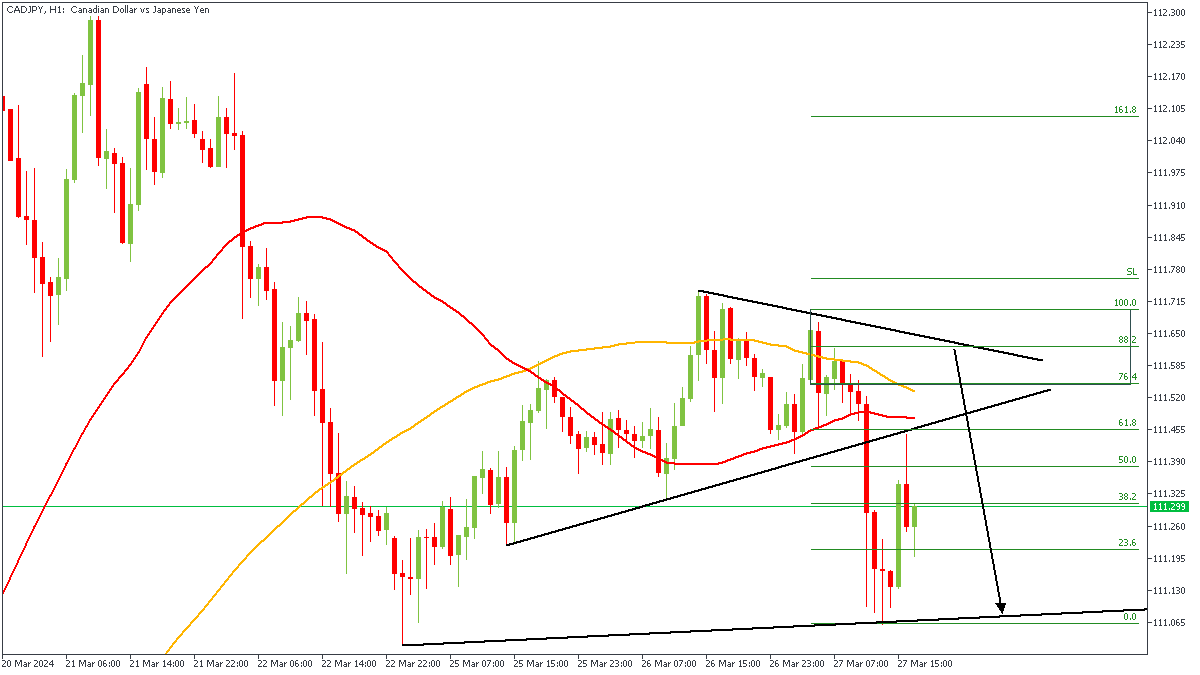
The breakout of price from the wedge pattern on the 1-hour timeframe of CADJPY can be seen to have created a break in the market structure. It is my expectation to see price complete a proper retest of the supply zone responsible for the break of structure. In line with this, the 88% of the Fibonacci retracement, bearish array of the moving averages, and the moving average resistance are my confluence for the bearish sentiment.
Analyst’s Expectations:
Direction: Bearish
Target: 111.232
Invalidation: 111.712
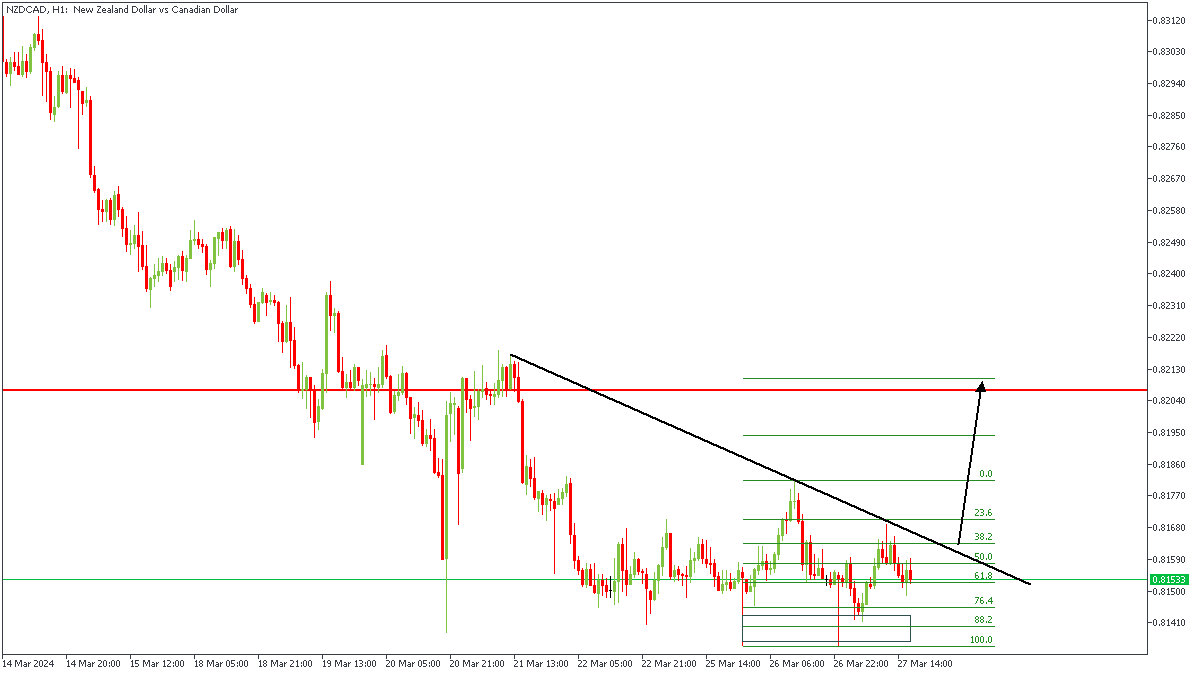
NZDCAD is currently consolidating below the trendline resistance, which indicates the likelihood of a breakout soon. Following this, I expect to see a breakout above the trendline resistance before settling for a long position on NZDCAD, in the meantime however, my fingers are crossed.
Analyst’s Expectations:
Direction: Bullish
Target: 0.82049
Invalidation: 0.81457
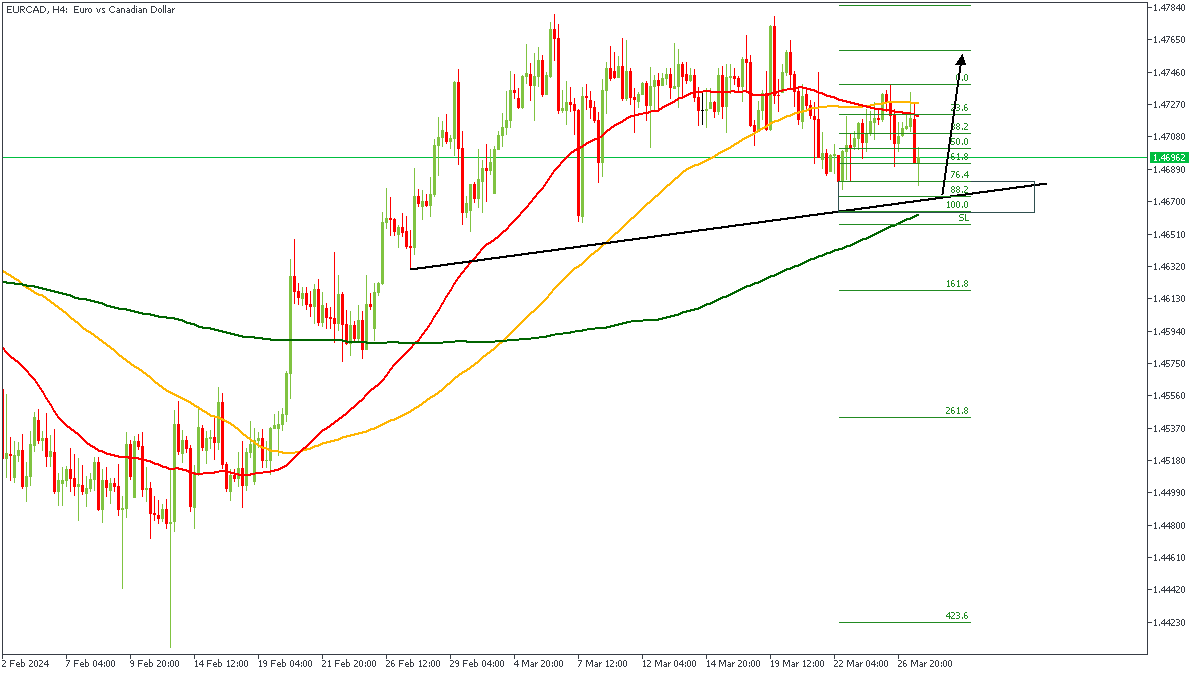
EURCAD is currently approaching a trendline support; implying the likelihood of a bullish rejection from the support line. There is also the presence of a Fibonacci retracement level, 200-period moving average support, and the demand zone as further confluences for the bullish sentiment.
Analyst’s Expectations:
Direction: Bullish
Target: 1.47460
Invalidation: 1.46604
The trading of CFDs comes at a risk. Thus, to succeed, you have to manage risks properly. To avoid costly mistakes while you look to trade these opportunities, be sure to do your due diligence and manage your risk appropriately.
You can access more of such trade ideas and prompt market updates on the telegram channel.

A estimativa para os números finais é que o PIB do quarto trimestre se mantenha na casa dos 3,2%, mostrando uma economia aquecida

As especulações de que as autoridades do BOJ irão intervir para conter qualquer fraqueza adicional do JPY mantêm um limite para quaisquer ganhos adicionais

Opiniões divergentes dos oradores do Fed sobre cortes de taxas prejudica o desempenho do USD

Depois da queda no mês de março em cerca de 26 mil vagas de emprego, a expectativa do mercado é de nova queda para 8,790M para o mês de fevereiro do mesmo ano

Nesta segunda-feira, primeiro dia do mês de abril, os EUA liberam os números dos PMIs da S&P Global e do ISM para a indústria

Todas as atenções estarão nos preços básicos do PCE (núcleo) dos EUA, que excluem alimentos e energia para o mês de março, com a expectativa de que os números venham abaixo do mês anterior, que registraram um aumento de 0,4%
A FBS mantém registros de seus dados para operar este site. Ao pressionar o botão “Aceitar“, você concorda com nossa Política de Privacidade.
Seu pedido foi aceito
Um gerente ligará para você em breve.
O próximo pedido de chamada para este número de telefone
estará disponível em
Se você tiver um problema urgente, por favor, fale conosco pelo
Chat ao vivo
Erro interno. Por favor, tente novamente mais tarde
Não perca seu tempo. Acompanhe o impacto das NFP no dólar dos EUA e ganhe dinheiro!
|


