

PIB dos EUA deve mostrar uma economia forte
A estimativa para os números finais é que o PIB do quarto trimestre se mantenha na casa dos 3,2%, mostrando uma economia aquecida
2024-03-22 • Atualizado
Canadian retail sales showed a slight rebound in February, rising by 0.1% after a 0.3% drop in January. However, this failed to fully offset the steeper decline earlier in the year, suggesting a weakening momentum in consumer spending. The increase in February was driven by gains in sectors such as sporting goods, hobby retailers, and building materials. Despite the improvement, ongoing challenges in retail sales growth, coupled with easing price pressures and a cooling job market, may prompt policymakers to consider adopting easier monetary policy in the coming months. However, there is little evidence of a sharp decline in retail activity that would urgently necessitate a rate cut by the Bank of Canada.
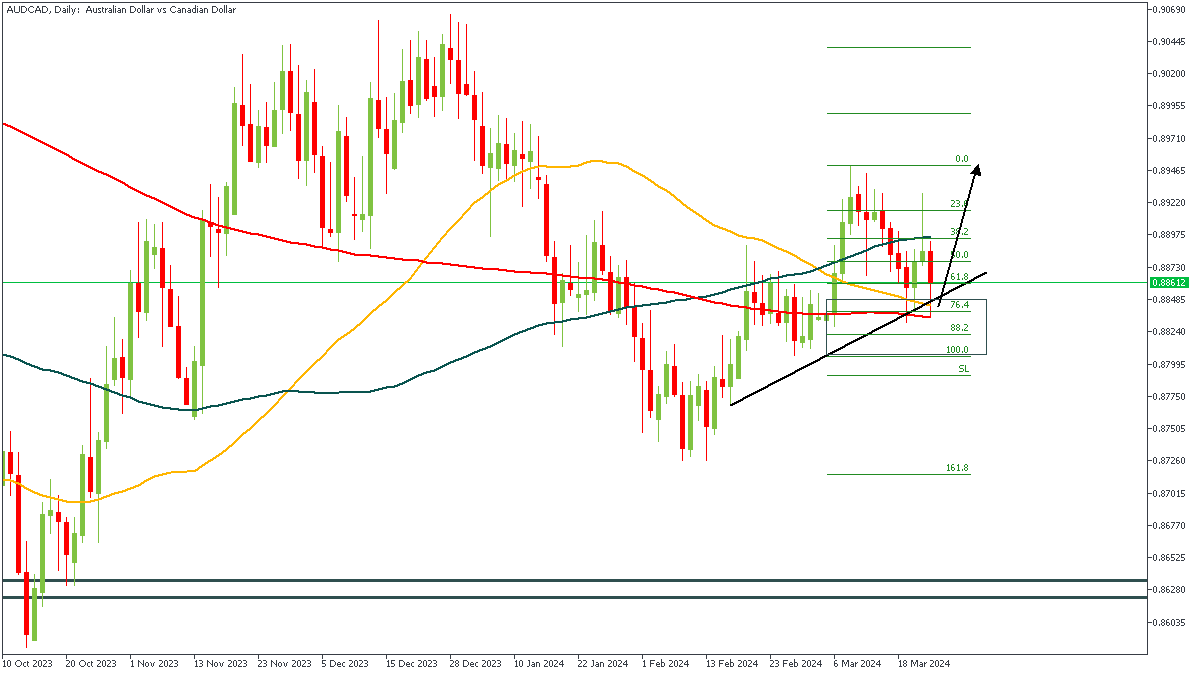
After breaking above the previous high on the daily timeframe, we’ve seen the price action on AUDCAD’s charts gradually slip back down to complete a retest of the drop-base-rally demand zone. In order to complete this execution, I have plotted a Fibonacci retracement tool, which shows me that the trendline support, and the moving average supports are all confirmations of my bullish sentiment.
Analyst’s Expectations:
Direction: Bullish
Target: 0.89154
Invalidation: 0.88040
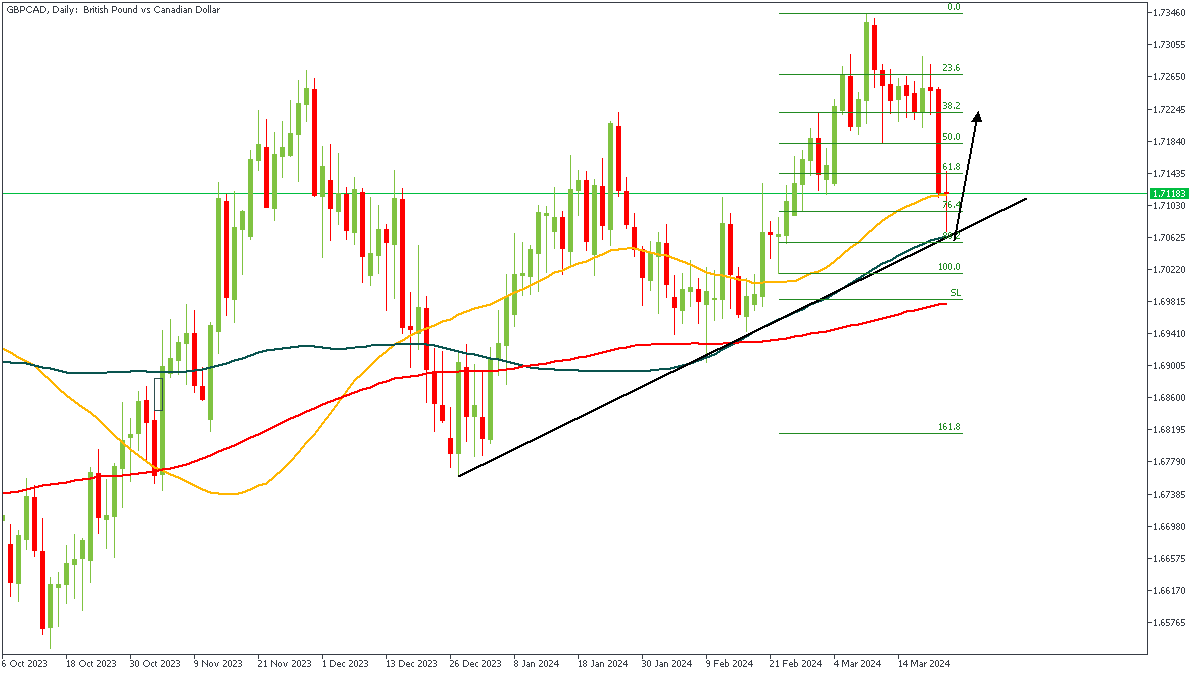
The price action on GBPCAD replays a textbook break-and-retest pattern; following the break above the previous high, we’ve seen price retest the demand zone as well as the trendline support - with a little help from the Fibonacci retracement level, and the moving average support. Clearly, the bullish array of the moving averages pretty much confirms a bullish sentiment to be factual.
Analyst’s Expectations:
Direction: Bullish
Target: 1.72204
Invalidation:1.70146
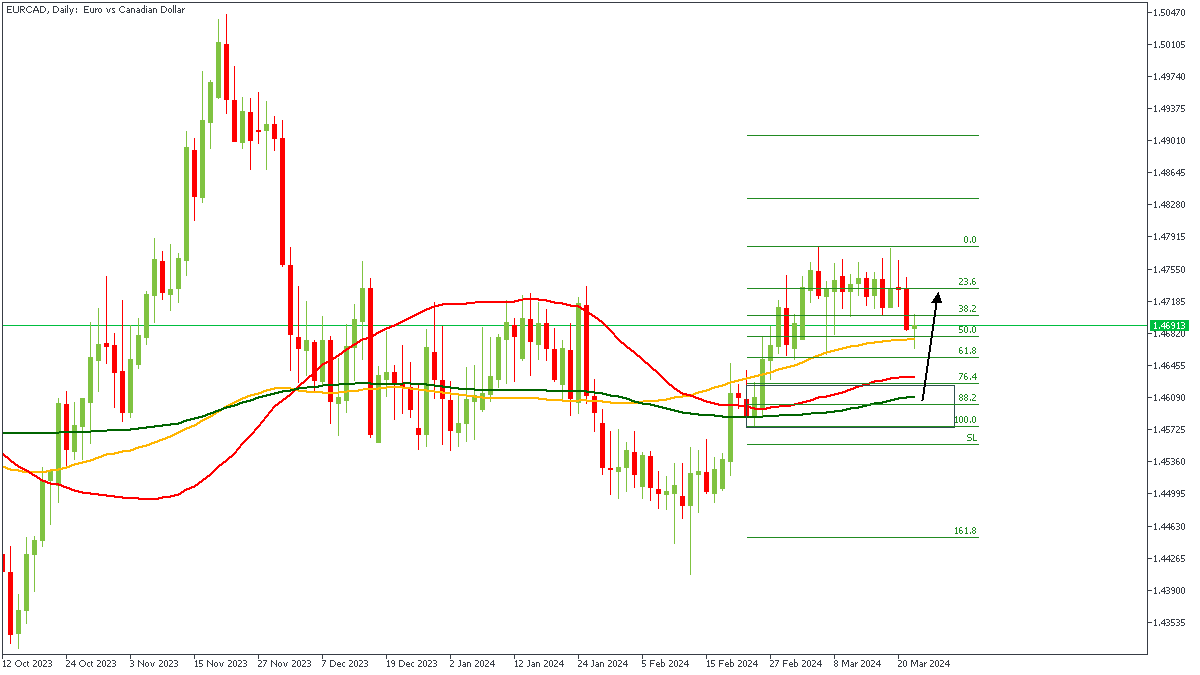
Here again we see the same pattern play out on the daily timeframe of EURCAD; we clearly see the uptrend as indicated by the break above the previous high, with the 50 and 200 period moving averages serving as support areas for the price action at the moment. Combining this with the drop-base-rally demand zone and the Fibonacci retracement levels, I think it’s safe to anticipate bullish price action from that region.
Analyst’s Expectations:
Direction: Bullish
Target: 1.47286
Invalidation: 1.45723
The trading of CFDs comes at a risk. Thus, to succeed, you have to manage risks properly. To avoid costly mistakes while you look to trade these opportunities, be sure to do your due diligence and manage your risk appropriately.
You can access more of such trade ideas and prompt market updates on the telegram channel.

A estimativa para os números finais é que o PIB do quarto trimestre se mantenha na casa dos 3,2%, mostrando uma economia aquecida

As especulações de que as autoridades do BOJ irão intervir para conter qualquer fraqueza adicional do JPY mantêm um limite para quaisquer ganhos adicionais

Opiniões divergentes dos oradores do Fed sobre cortes de taxas prejudica o desempenho do USD

Depois da queda no mês de março em cerca de 26 mil vagas de emprego, a expectativa do mercado é de nova queda para 8,790M para o mês de fevereiro do mesmo ano

Nesta segunda-feira, primeiro dia do mês de abril, os EUA liberam os números dos PMIs da S&P Global e do ISM para a indústria

Todas as atenções estarão nos preços básicos do PCE (núcleo) dos EUA, que excluem alimentos e energia para o mês de março, com a expectativa de que os números venham abaixo do mês anterior, que registraram um aumento de 0,4%
A FBS mantém registros de seus dados para operar este site. Ao pressionar o botão “Aceitar“, você concorda com nossa Política de Privacidade.
Seu pedido foi aceito
Um gerente ligará para você em breve.
O próximo pedido de chamada para este número de telefone
estará disponível em
Se você tiver um problema urgente, por favor, fale conosco pelo
Chat ao vivo
Erro interno. Por favor, tente novamente mais tarde
Não perca seu tempo. Acompanhe o impacto das NFP no dólar dos EUA e ganhe dinheiro!
|


